PulseFlow is a backend platform designed for real-time data processing and visualization, leveraging enterprise-grade technologies. This project showcases advanced capabilities in data simulation, monitoring, and analytics, all built on modern DevOps practices
- Real-time social media data processing
- Sentiment analysis tracking
- Platform usage analytics
- Engagement metrics monitoring
- Performance and health monitoring
- Robust error handling and metrics tracking
- Secure integration with cloud services
- Backend: Node.js + Express with TypeScript
- Database: MongoDB with Mongoose ODM
- Containerization: Docker & Docker Compose
- Message Queue: RabbitMQ with CloudAMQP
- Testing: Jest with comprehensive test coverage
- Code Quality: ESLint, Prettier, and automated pre-commit hooks
- Microservices-based Design: Modular architecture for scalability and maintainability.
- MongoDB Data Storage: Efficient and scalable data management.
- Real-time Metrics Collection: Continuous monitoring of system performance.
- Custom Dashboards: Visual insights through Grafana and MongoDB Charts.
- RabbitMQ with CloudAMQP: Utilizes a managed RabbitMQ service for distributed message processing.
- Configuration: Secure, encrypted connections with elastic scaling.
- Key Features: Reliable message queuing, automatic message routing, and error handling with dead-letter queues.
- Message Flow: Synthetic tweet data is generated, published to RabbitMQ, processed asynchronously, and stored in MongoDB.
- Continuous Integration: GitHub Actions
- Container Registry: GitHub Container Registry
- Container Orchestration: Docker Compose
- Pre-commit Hooks: Automated code quality and testing checks
The project implements a comprehensive testing approach:
- Unit Tests: For individual components and functions
- Integration Tests: Validates interactions between components
- Automated Testing: Integrated with CI/CD and pre-commit hooks
- Mocking: Sophisticated mocking for external dependencies
See SECURITY.md file for details on:
- Recent security updates addressing CVE-2023-45853
- Container security hardening
- Recommended security practices
- Code quality enhancements
- Metrics: Prometheus with custom metrics collection
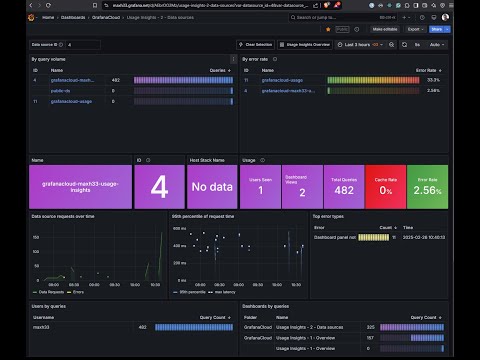
- Dashboards: Grafana with real-time data visualization
- Health Checks: Custom endpoints with prometheus-client
- MongoDB Charts: For data-specific visualizations
The application exports metrics in Prometheus format and pushes them to Grafana Cloud. A local monitoring stack is also available through Docker Compose.


>> SOON View LIVE Grafana Dashboard HERE <<


>> SOON View LIVE MongoDB Charts Dashboard HERE <<

- Data Source: Synthetic data generation
- Randomization Techniques:
- Probabilistic content creation
- Realistic social media interaction patterns
- Machine learning-based sentiment simulation
- Randomized user profiles
- Contextually relevant tweet content
- Simulated engagement metrics
- Realistic temporal distribution
- Sentiment spectrum simulation
- Markov chain text generation
- Weighted sentiment scoring
- Gaussian distribution for interaction rates
- Time-based event probability modeling
🚨 Note: All data is artificially generated and does not represent real social media interactions.
- Data Generation: Synthetic tweets created with Chance.js.
- Message Queuing: Data published to RabbitMQ, ensuring reliable processing.
- Data Storage: Tweets stored in MongoDB for efficient access.
- CI/CD: Automated tests and deployment via GitHub Actions.
- Hosting: Application deployed on Render for scalability.
- Monitoring: Metrics collected and visualized in Grafana.
- CodeFactor Grade: A (Excellent)
- Snyk Security: No known vulnerabilities
- Continuous Monitoring: Automated checks on every commit
- Static code analysis
- Dependency vulnerability scanning
- Best practices enforcement
- Security risk assessment
- OWASP Top 10 considerations
- Secure coding standards
- Regular automated inspections
Contributions are welcome! Please read our contributing guidelines and submit pull requests.