![]()
Effconnpy is a Python library for advanced causal inference and connectivity analysis in time series data, offering both bivariate and multivariate approaches.
The toolbox assumes that neuroimging data (e.g. from Nifti files) have been already pre-processed e.g. with fMRI-prep, and parcellated, therefore the time series have been saved in text files as .tsv
and can easily be loaded into a dataframe.

.png)
Two core classes provide bivariate causal inference methods:
Basic methods include:
- Bivariate Granger Causality (traditional linear, and non-linear implemented by reservoir computing networks)
- Bivariate Transfer Entropy
- Bivariate Convergent Cross Mapping
Extended methods include:
- Dynamic Bayesian Network
- Structural Equation Modeling
- DoWhy Causal Discovery
- Dynamic Causal Modeling
Three specialized multivariate approaches:
- Based on methodology by Barnett & Seth, Journal of Neuroscience Methods 2014
- VAR model-based causality inference
- Log-likelihood ratio testing
- Inspired by Nithya & Tangirala, ICC 2019
- Nonlinear causality detection
- Network-based causal relationship visualization
- Methodology from Duan et al. 2022
- Information-theoretic causality measure
- Supports conditional transfer entropy
N.B. The multivariate implementations are not considered state-of-the-art and are not fully tested, please report any error or bug.
-
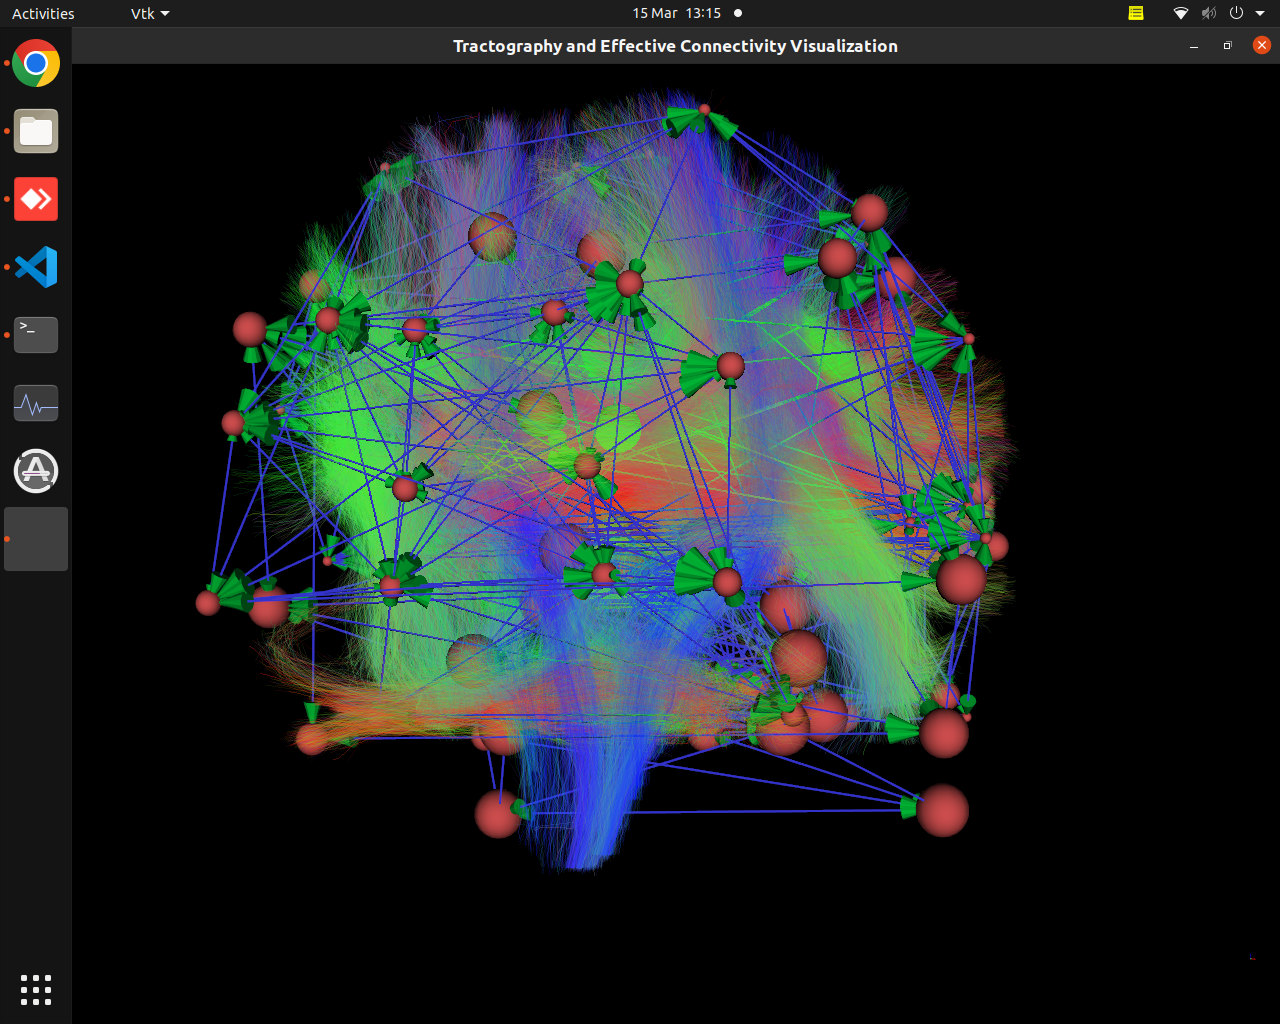
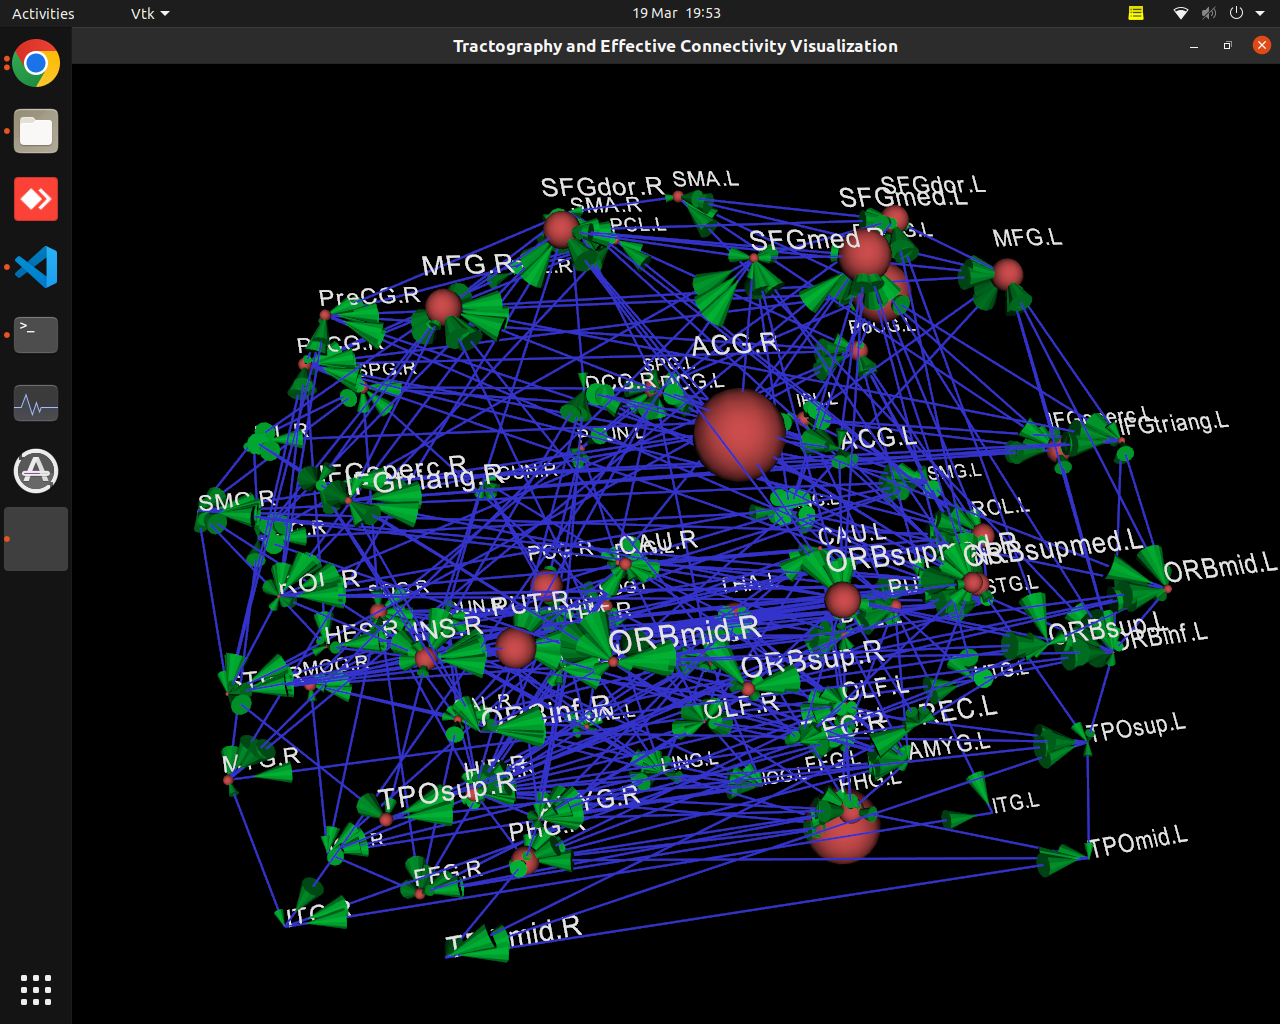
Plotting of directed graphs, also overlapping with tractography and node labels
-
Directionality of the connections as color gradients
-
Visualization of time series over structural connections (currently not working properly[#8])
pip install effconnpyfrom effconnpy import CausalityAnalyzer , create_connectivity_matrix
import numpy as np
# Generate sample time series
data = np.random.rand(100, 3)
analyzer = CausalityAnalyzer(data)
results = analyzer.causality_test(method='granger')
print(results)
binary_matrix = create_connectivity_matrix(results, method = 'granger')
print(binary_matrix)from effconnpy.multivariateGC import MultivariateGrangerCausality
from effconnpy import create_connectivity_matrix
import numpy as np
# Generate sample time series
#The first 2 time series are related by a logistic causal mapping,
#while the third is random and has no causal relationship with the others
# Parameters
T = 100 # Number of time steps
x = np.zeros(T)
y = np.zeros(T)
# Initial conditions
x[0] = 0.5
y[0] = 0.5
# Iterate the system
for t in range(T - 1):
x[t + 1] = x[t] * (3.8 - 3.8 * x[t])
y[t + 1] = y[t] * (3.1 - 3.1 * y[t] - 0.8 * x[t])
z = np.random.rand(100)
data = np.vstack((x, y,z)).T
analyzer = MultivariateGrangerCausality(data)
results = analyzer.multivariate_granger_causality()
print(results)Indeed, there is also a causal time series generator script to generate ground-truth time series which can be complemented by random or other time series:
    from effconnpy import timeseriesgenerator
    # Create an instance of the generator
    generator = TimeSeriesGenerator()
    # Generate some example data
    n_points = 1000

    # Lorenz system
    t, x, y, z = generator.lorenz_system(n_points)

    # Coupled logistic map
    logistic_x, logistic_y = generator.coupled_logistic_map(n_points)

    # Kuramoto oscillators
    kura1, kura2 = generator.kuramoto_oscillators(n_points)

    # AR process
    ar_x, ar_y = generator.ar_process(n_points)

    # Nonlinear coupled system
nl_x, nl_y = generator.nonlinear_coupled_system(n_points)from effconnpy import vis_effconn
node_file = "Node_AAL90.node"
edge_file = "my_effconn.csv"
vis_effconn(node_file, edge_file, show_tractography=True)This will show the overlay of a tractography from the HCP dataset over a connectome according to an atlas with given nodes coordinates, and the effective connectivity computed and saved in a csv file. If a structural connectivity matrix (non-effective) is passed, the function will show arrows on both directions for all edges.
If you use the tool please refer to those papers
"Structurally constrained Granger causality" A. Crimi et al. Neuroimage 2021
Contributions welcome! Please read our contributing guidelines before submitting pull requests. Currently disabled, just open issues and I will follow up
MIT License