Bug in mplot3D with PolyCollection: (0, 0) data point is always inserted into the data set. #2533
Comments
|
@WeatherGod: any thoughts? |
|
related to http://stackoverflow.com/questions/16305256/couldnt-remove-origin-point-in-matplotlib-polycollection which generated issue #2045 |
|
closed by #3239 |
Sign up for free
to join this conversation on GitHub.
Already have an account?
Sign in to comment
This a a bug related to stacked xy-plots example,
http://matplotlib.org/examples/mplot3d/polys3d_demo.html
matplotlib seems to be inserting a vertex at (0,0) into the data set.
The following example is based on the
poly3d_demoscript linked above. If we change the data set so that the data doesn't include a point at x=0, for example change line 12 from,to,
A erroneous line is drawn from the data set to the (0,0) point.
The following script produces the result(s) below, using matplotlib 1.3.0.
Example 1
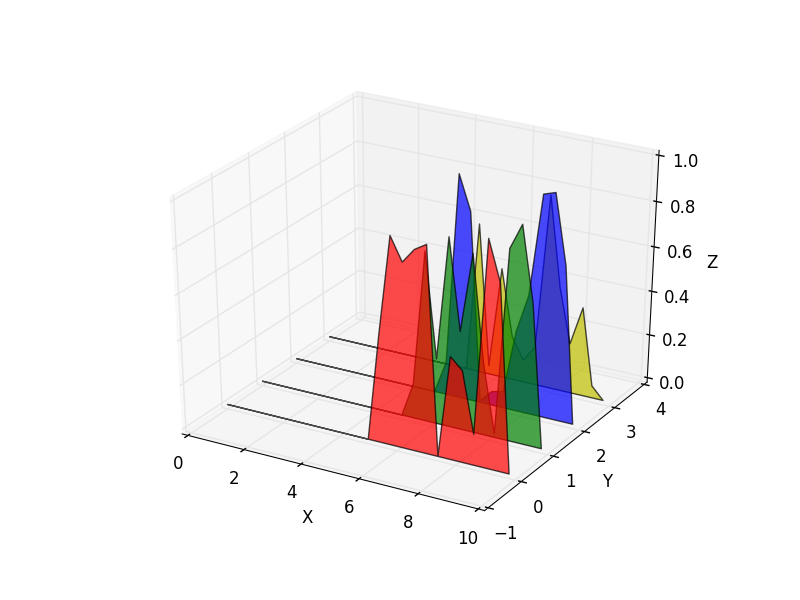
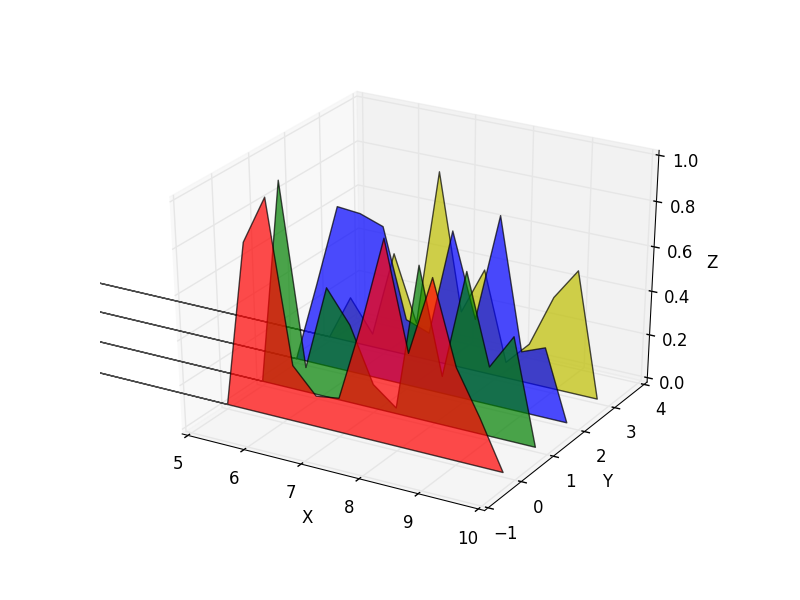
When the x-axis is changed to only include the range of the data set the result look even worse,
Example 2
The text was updated successfully, but these errors were encountered: