Plots using twinx draw on top of figure frame #2472
Merged
Conversation
This file contains bidirectional Unicode text that may be interpreted or compiled differently than what appears below. To review, open the file in an editor that reveals hidden Unicode characters.
Learn more about bidirectional Unicode characters
|
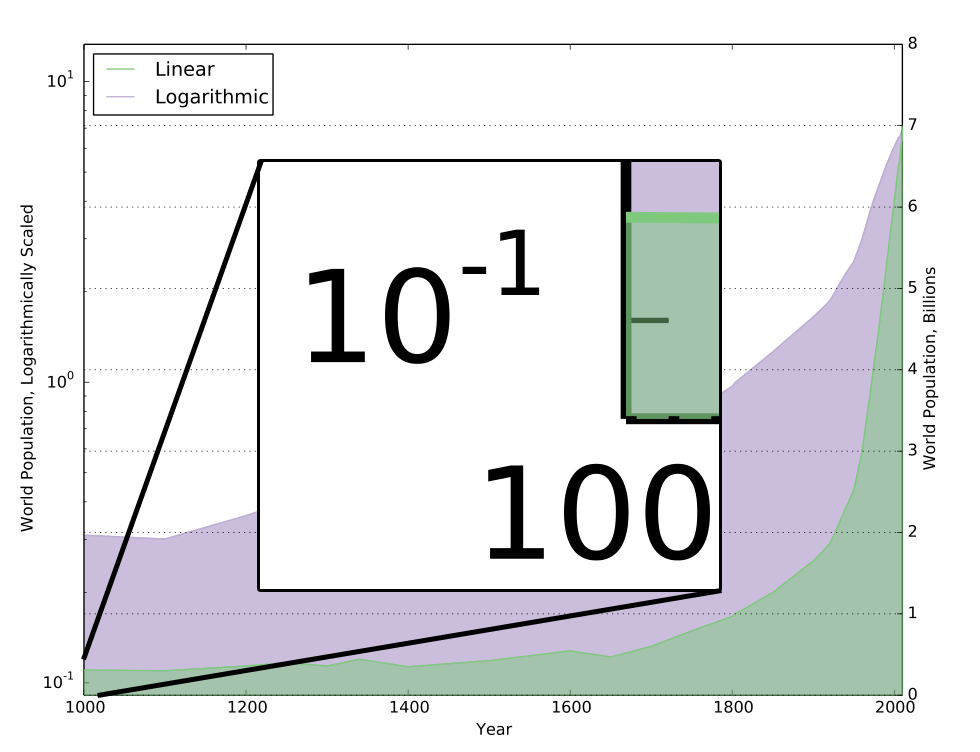
As a related issue, the twinx Axis is always on top of the base Axis. In this case, the green chart will always be on top of the purple chart, regardless of the zorder applied in the plot commands. |
|
A possible fix is attached. |
|
Looks good, diff fixes it on my end. |
mdboom
added a commit
that referenced
this pull request
Oct 14, 2013
Plots using twinx draw on top of figure frame
pelson
added a commit
that referenced
this pull request
Oct 29, 2013
* upstream/v1.3.x:
  Update version to 1.3.1
  tiny correction of matplotlibrc.template
  minor docstring fix in dates.py
  Updated the docs of pyplot.gca.
  Fix #2472: Draw the spines on top of twin axes
  changes to c++ because gcc 4.8 seems to allow things the compiler on travis will not.
  added class variable `_fill_color` to RendererAgg to hold the color to use in `clear` calls to the render_base.
  patch to fix issue #2473.

Conflicts:
	lib/matplotlib/__init__.py
	lib/matplotlib/axes/_axes.py
Sign up for free
to join this conversation on GitHub.
Already have an account?
Sign in to comment
Add this suggestion to a batch that can be applied as a single commit.
This suggestion is invalid because no changes were made to the code.
Suggestions cannot be applied while the pull request is closed.
Suggestions cannot be applied while viewing a subset of changes.
Only one suggestion per line can be applied in a batch.
Add this suggestion to a batch that can be applied as a single commit.
Applying suggestions on deleted lines is not supported.
You must change the existing code in this line in order to create a valid suggestion.
Outdated suggestions cannot be applied.
This suggestion has been applied or marked resolved.
Suggestions cannot be applied from pending reviews.
Suggestions cannot be applied on multi-line comments.
Suggestions cannot be applied while the pull request is queued to merge.
Suggestion cannot be applied right now. Please check back later.
While attempting to plot two figures on the same x axis, I noticed that plots were drawing pixels on top of the figure frame. This only seems to happen from Axes derived from a twinx() call. Sample code below should reproduce the problem.
In the image below, the green plot and fill is on top of the frame on the left, bottom, and right.
Currently using matplotlib 1.3.0 through Anaconda x64 1.9.1 on Windows