Skip to content
New issue

Have a question about this project? Sign up for a free GitHub account to open an issue and contact its maintainers and the community.

By clicking “Sign up for GitHub”, you agree to our terms of service and privacy statement. We’ll occasionally send you account related emails.

Already on GitHub? Sign in to your account

VR output depends on output sampling rate #520

Open
sebwolf-de opened this issue Mar 24, 2022 · 11 comments
Open

VR output depends on output sampling rate #520

sebwolf-de opened this issue Mar 24, 2022 · 11 comments
Labels

Comments

@sebwolf-de
Copy link
Contributor

sebwolf-de commented Mar 24, 2022

Describe the bug
When I run a simulation with different fault output sampling rate, I get different results for Vr.

Expected behavior
The output at a specific time should not depend on the sampling rate.

To Reproduce
Steps to reproduce the behavior:

  1. Kind of recent master: 94b4478
  2. Supermuc-NG, standard modules, intel compiler
  3. https://github.com/7bits-register/precomputed-seissol/tree/master/tpv105, checkout 4359a98, change printtimeinterval_sec to 0.1 and 1.0 respectively.

Screenshots/Console output
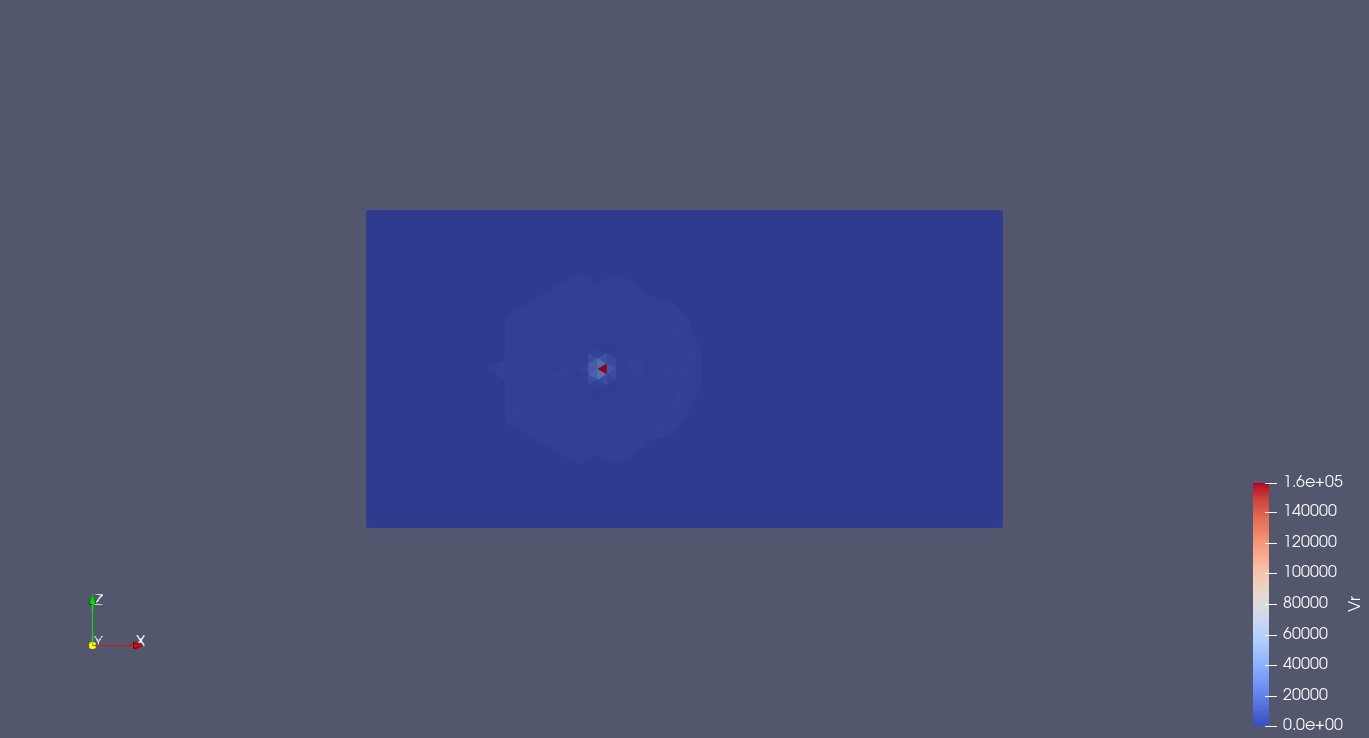
Vr after 2s, output sampled with 0.1s
0_1s
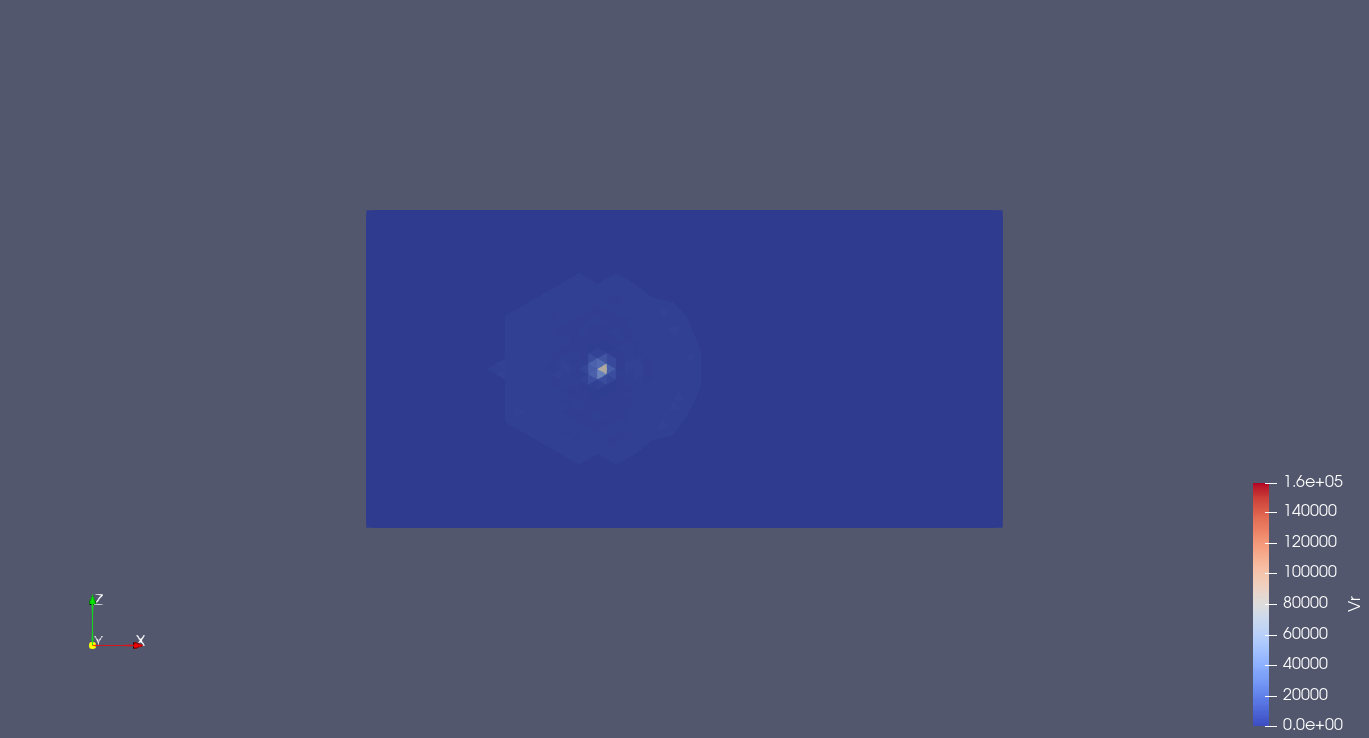
Vr after 2s, output sampled with 1.0s
1_0s

@sebwolf-de sebwolf-de added the bug label Mar 24, 2022
@Thomas-Ulrich
Copy link
Contributor

Thomas-Ulrich commented Mar 24, 2022

did you use the same number of nodes? How many? Which order? Single/double?

@sebwolf-de
Copy link
Contributor Author

Same number of nodes, 1 node, it's a small setup, which I use for fast testing. Double precision

@Thomas-Ulrich
Copy link
Contributor

Do you have the path to the folder on supermuc?

@sebwolf-de
Copy link
Contributor Author

/hppfs/work/pr83no/ga35kum3/precomputed-seissol/tpv105

@Thomas-Ulrich
Copy link
Contributor

So RT is not really matching, and this may translate non-linearly onto rupture speed.
Could it be possible that because quadrature nodes are not symmetric, and because from one run to the other we have different configurations of quadrature nodes (??), we get large discrepancies on such a very coarsely meshed fault?
Here is the output on the comparison script updated with #524

python ~/SeisSol/SeisSol/postprocessing/science/compute_diff_seissol_data.py output-master-0.1s/tpv-fault.xdmf output-master-1s/tpv-fault.xdmf --Data all --idt -1
same indexing detected, no need to reindex arrays
#idt relative_error_l2 relative_error_l1 min_abs_error max_abs_error
P_n
0 nan nan 0.0 0.0
1 3.1511831521811967e-06 0.0013058581974787322 -56012.16974791279 83385.28009203076
Sld
0 nan nan 0.0 0.0
1 1.7428337953945102e-05 0.002821718239846661 -0.0005663818915783887 0.000615650296502665
Mud
0 0.0 0.0 0.0 0.0
1 2.3547347992045557e-06 0.0002506153673626205 -0.007216626619914623 0.009004572571804204
P_f
0 nan nan 0.0 0.0
1 1.380575536023293e-09 2.8079277788487047e-05 -871.6507176421583 35.217783842235804
Tmp
0 0.0 0.0 0.0 0.0
1 2.890712258037059e-12 2.2783266744807332e-07 -0.0003209817151628158 0.012387331174068095
ASl
0 nan nan 0.0 0.0
1 5.663671754129856e-06 0.002693059509279129 -0.0008578767852485125 0.00659223426043648
u_n
0 nan nan 0.0 0.0
1 0.00015879073481851012 0.012243046176811104 -0.017593933809486817 0.015088651452650148
Td0
0 0.0 0.0 0.0 0.0
1 0.00010761483538765832 0.010163030198616642 -114794.76320773922 66044.95415237406
Sls
0 nan nan 0.0 0.0
1 5.656727919271716e-06 0.0026932700607374435 -0.0008558211184752085 0.006588623176524755
T_s
0 0.0 0.0 0.0 0.0
1 2.5073093288912855e-05 0.0044434152594407085 -299578.9956366541 330690.1571730338
Vr
0 nan nan 0.0 0.0
1 0.20980592751521493 0.17060781860796964 -9401.761029649868 76962.84735442357
Pn0
0 0.0 0.0 0.0 0.0
1 4.73835596692103e-09 9.67397206023388e-06 -56012.169747911394 83385.28009203076
DS
0 nan nan 0.0 0.0
1 nan nan 0.0 0.0
SRd
0 nan nan 0.0 0.0
1 0.00022938208077466228 0.016904869962667716 -0.006073249131573276 0.006445062376409183
SRs
0 nan nan 0.0 0.0
1 5.925915547772537e-05 0.005909880671656212 -0.03243561509605897 0.07132848997421659
PSR
0 nan nan 0.0 0.0
1 2.479041454411632e-05 0.0019867474583827646 -0.014166973752637313 0.09918215640822625
RT
0 nan nan 0.0 0.0
1 0.012229375596126425 0.010546709624873859 -0.002595120538917306 0.9963960147769233
StV
0 0.0 0.0 0.0 0.0
1 5.727742262003654e-07 8.194140889277383e-05 -0.007300188215939807 0.0012863962890721226
Ts0
0 0.0 0.0 0.0 0.0
1 2.1916415941019644e-06 0.00024787390896933786 -299578.99563665316 330690.1571730338
T_d
0 0.0 0.0 0.0 0.0
1 0.00010761483538765832 0.010163030198616637 -114794.76320773922 66044.95415237406

@Thomas-Ulrich
Copy link
Contributor

To this my hypothesis, you could check RT output with dr/cpp and Dunavant quad rule?

@sebwolf-de
Copy link
Contributor Author

sebwolf-de commented Mar 29, 2022

It doesn't improve with the Dunavant rule:

python ~/SeisSol/master/postprocessing/science/compute_diff_seissol_data.py output-dunavant-0.1s/tpv-fault.xdmf output-dunavant-1s/tpv-fault.xdmf --Data all --idt -1 
RT
0 nan nan 0.0 0.0
1 0.024159154577083692 0.019421672160058374 -0.0023550641726290955 0.9963960147769233
Vr
0 nan nan 0.0 0.0
1 0.16015406945759145 0.131543503114684 -21224.236287209867 3682.369291023566

Note that the VR output for the Dunavant rule is not working due to the shift of quadpoints, which we already discussed in #513.

@sebwolf-de
Copy link
Contributor Author

I'll try again with the mesh resolution from the Examples Repository...

@Thomas-Ulrich
Copy link
Contributor

ok but overall, can we say that the issue is that:
VR output may vary across runs of identical setup
I mean, I don't think the problem is with the output sampling rate (although I did not test that).
By the way, the misfit of RT is actually large because on one cell, RT is not yet define for one simulation and is defined for the other, so RT_diff=1.

--- a/postprocessing/science/compute_diff_seissol_data.py
+++ b/postprocessing/science/compute_diff_seissol_data.py
@@ -234,6 +234,9 @@ for dataname in variable_names:
     myData = (
         myData1[0 : ndt * step1 : step1, ind1] - myData2[0 : ndt * step2 : step2, ind2]
     )
+    if dataname=='RT':
+        myData[myData>0.8] = 0
+        print('warning, manually changing RT here')
     for idt in args.idt:
         if idt < ndt:
             ref_norm1 = l1_norm(areas, myData1[idt * step1, ind1])

gives

RT
warning, manually changing RT here
0 nan nan 0.0 0.0
1 2.711086066576235e-06 0.0014708392831947023 -0.002595120538917306 0.0025464813199052028

image

@Thomas-Ulrich
Copy link
Contributor

Overall, the problem is that in this setup, the nucleation stress is added instantaneously overall the whole nucleation region, only the amount of shear stress added varies with time. The nucleation increment has a 2d bell shape, which kind of induces some concentric nucleation, but it might still be very instantaneous locally, and Vr very sensitive to small variations of RT.
Maybe we should exclude the nucleation area from the CI:
image

@sebwolf-de
Copy link
Contributor Author

That explains, why it is a problem in tpv105 only and not in the other tpvs. For #522 I'll disable the RT and Vr output.

Sign up for free to join this conversation on GitHub. Already have an account? Sign in to comment
Labels
Projects
None yet
Development

No branches or pull requests

2 participants