Adding data labels to mean and process limits #87
Comments
|
Not at all, we're very happy for the suggestions!
Would you have an example of how you'd (ideally) like this to look (label placement, etc.)? |
|
Thanks so much for all of this! Making our transition from Excel to PowerBI possible as we are very SPC dependent in our reporting!! This is how we do ours in Excel: |
|
Ah I see what you mean, yep that should be possible. I'm still in the process of figuring out the best way to add annotations to visuals, so this one might take a little longer though |
|
No worries - thanks so much! |
Sign up for free
to join this conversation on GitHub.
Already have an account?
Sign in to comment
Hello,
Apologies for all the requests - just very excited to finally have a great SPC tool!
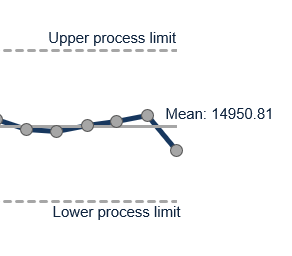
Wondering if it's possible to add data labels to the mean and process limit lines to show the values on the SPC?
Thanks,
Bethany
The text was updated successfully, but these errors were encountered: