Pagespeed insights credibility issues #7017
Comments
|
I am in complete agreement with this view. Looking at real mobile/3G user data it's obvious that Lighthouse is overly pessimistic about page performance - and by a huge margin. Would it be possible to tune the calculated the score based on averages of real sites or, even better, real data? From my personal experience/opinion I'd be giving cnn around 75 but I've just run it through Lighthouse and got 4! While the original poster is having problems with internal communication some companies seem to be using this to make commercial decisions so it's having a real world impact. |
|
@mrtom808 Thank you for adding your voice, it means a lot to know I'm not the only one. To elaborate a bit more. I'm fine with Lighthouse scoring as harsh as it does within devtools. It focuses on a very particular angle of web performance, being mobile-first web performance under the most harsh conditions: cheap devices on poor networks. The error is in taking this highly specific angle and using it as an indicator for all web performance, and to communicate it widely to non-technical stakeholders. You got 4 for CNN? I got 1 :) I also recently did a test with a hello world page, and hosted it on Akamai, a pretty good CDN I'd say. It really was just hello world, the start render time was 2.7s on crappy 3G, you know, because of the connection overhead. And that means it is scoring as orange. And that's what I mean with unachievable targets. It looks like the only way to do well is to just throw away the web as a whole and rebuild everything into a PWA with full offline support, code splitting. async workers or whatever is Google's view of the day on how the web should be built. Sorry if that was too cynical, but I truly believe we need to widen the definition of what the web is and come to realistic, achievable targets. The web is more than simplistic nihilistic apps, it has tons of legacy, some of which will never be updated, it serves many types of audiences that are not just mobile and if on mobile not all on crappy connections, and it is built on different archetypes (server-rendered, client-rendered). We need some realism on what defines good or bad performance and I don't feel the current scoring model does that. Which, again, is fine within devtools, but not fine within Pagespeed. I don't know what to answer to a business stakeholder wondering why we score so poorly:
I really don't have a better answer right now. |
|
We really need to question it's credibility. https://developers.google.com/speed/pagespeed/insights/?url=hebrewnational.com It says this page loads in 5.6 seconds, but you could save over 9 seconds with WebP images, and another 6 seconds by optimizing images. Does this mean 10 seconds before we hit enter on the browser, the site loads? I just think of hotdogs and WebP's encoding algorithm is so good that it predictively knows and loads the site for me? Yeah, I think alot of the numbers published on this are scare tactics to force developers into rushing into WebP and other proprietary google technology. |
No, in this case it means that the time difference when the last byte would finish downloading, i.e. when all the images have finished loading, is 10 seconds. This is computed based on the estimated byte savings. Downloading fewer bytes means images load earlier even if their load time isn't captured by Time to Interactive. I hope this helps clear some things up a bit. Also worth noting, the opportunities do not factor into the score at all. Lighthouse just wants to see a performant page, no matter how you get there. They are purely there as advice. We've heard loud and clear that this needs to be communicated more effectively in the report itself. Whether a particular opportunity's savings is worth the implementation cost is certainly a good debate to have, but writing off all of the opportunities as scare tactics would be a really unfortunate loss. |
|
Then don't use tactics designed to scare the developer community. We should also talk about the 1.6mb simulated mobile connection used too. 93% of all mobile users in North America are on LTE (source: https://www.ericsson.com/en/mobility-report/mobility-visualizer?f=1&ft=2&r=4&t=1,2,3,4,5,6,7&s=1,2,3&u=1&y=2017,2018&c=1 ) and the average download speed on mobile in North America is 27.33mb (source: https://www.speedtest.net/reports/united-states/2018/mobile/ ). Choosing a connection speed that less than 7% of the population use as the 'norm' is misleading. I can have a page with none of your recommended optimization opportunities score a 93%, and another where I do all of them and score a 72%. This doesn't even account for the score changing with consecutive tests. I can run 5 tests and have a range in scores of up to 20 points. I have to work for stakeholders that have a different technical set of understanding. They see a red or yellow score and get upset. We can have pages with sliders, accordions, and other javascript-based elements and get dinged for pulling code or libraries. They don't want to compromise on functionality at all, but want scores in the 90's. You need to adjust the scoring criteria on a much different curve than what's implemented, or else you will see a surge of developers telling higher ups that the google pagespeed score is fear mongering. I always did root for Google in the technology space, but you really need to change the scoring criteria, and quickly. |
|
@patrickhulce What are your thoughts on the definition of a "performant" page being way too aggressive, unrealistic, and therefore counter-productive? My question/discussion concerns scoring, not the advise/opportunities (which I think are in no shape to be shared with a business audience, but different topic). CNN a score of 1? Youtube in the red? Amazon in the red? Come on, this can't be right. If this is as intended and not a calibration mistake, I see no point in using this tool to gauge performance. Even if 90% of one's audience experiences a great performance, the score is still red. It's impossibly strict in a nihilistic way. |
|
The biggest problem Pagespeed Insights is out there; it's public, there's tons of blog posts about it, its' pushed as a public product and has a forward-facing website designed for ease-of-use to the point where our stakeholders and bosses, many who might be laymen, will see a score in the red and give us developers unreasonable demands. If this was strictly segregated to Lighthouse, a browser-only tool that most need at least some technical knowledge to use, this would be an entirely different conversation. |
|
First off, thank you all for engaging in conversation here. This is how we all get to where we want to be! Now...
Obviously, a situation where the world gives up on improving a metric makes that metric not very useful, and I certainly don't want Lighthouse to be in that situation. Quick question for you folks to gut check something: Do you think the business side typically needs more convincing to let devs work more on performance? One of my foundational beliefs is that developers are willing and able to work on improving performance but that constraints placed on them by the business prevent them from doing so, i.e. "add this tag X", "stop trimming the bundle and add feature Y", "you have to use 3rd party tracking script Z", "put these 7 ad networks on the page", etc. If this is to change, the business side has to be...
In your organizations, what would be the ideal way to connect the score directly to the actions the business makes that hurt performance? I agree the situation where all the blame falls on the developer is one where nobody wins. Help me change that! :) As for the scores...
I'm quite happy to stand behind this one. CNN has a horrendous mobile experience perf-wise, they're aware of it, and they want help improving! Awesome for them! (checkout the message they leave for visitors in the console 😄 ).
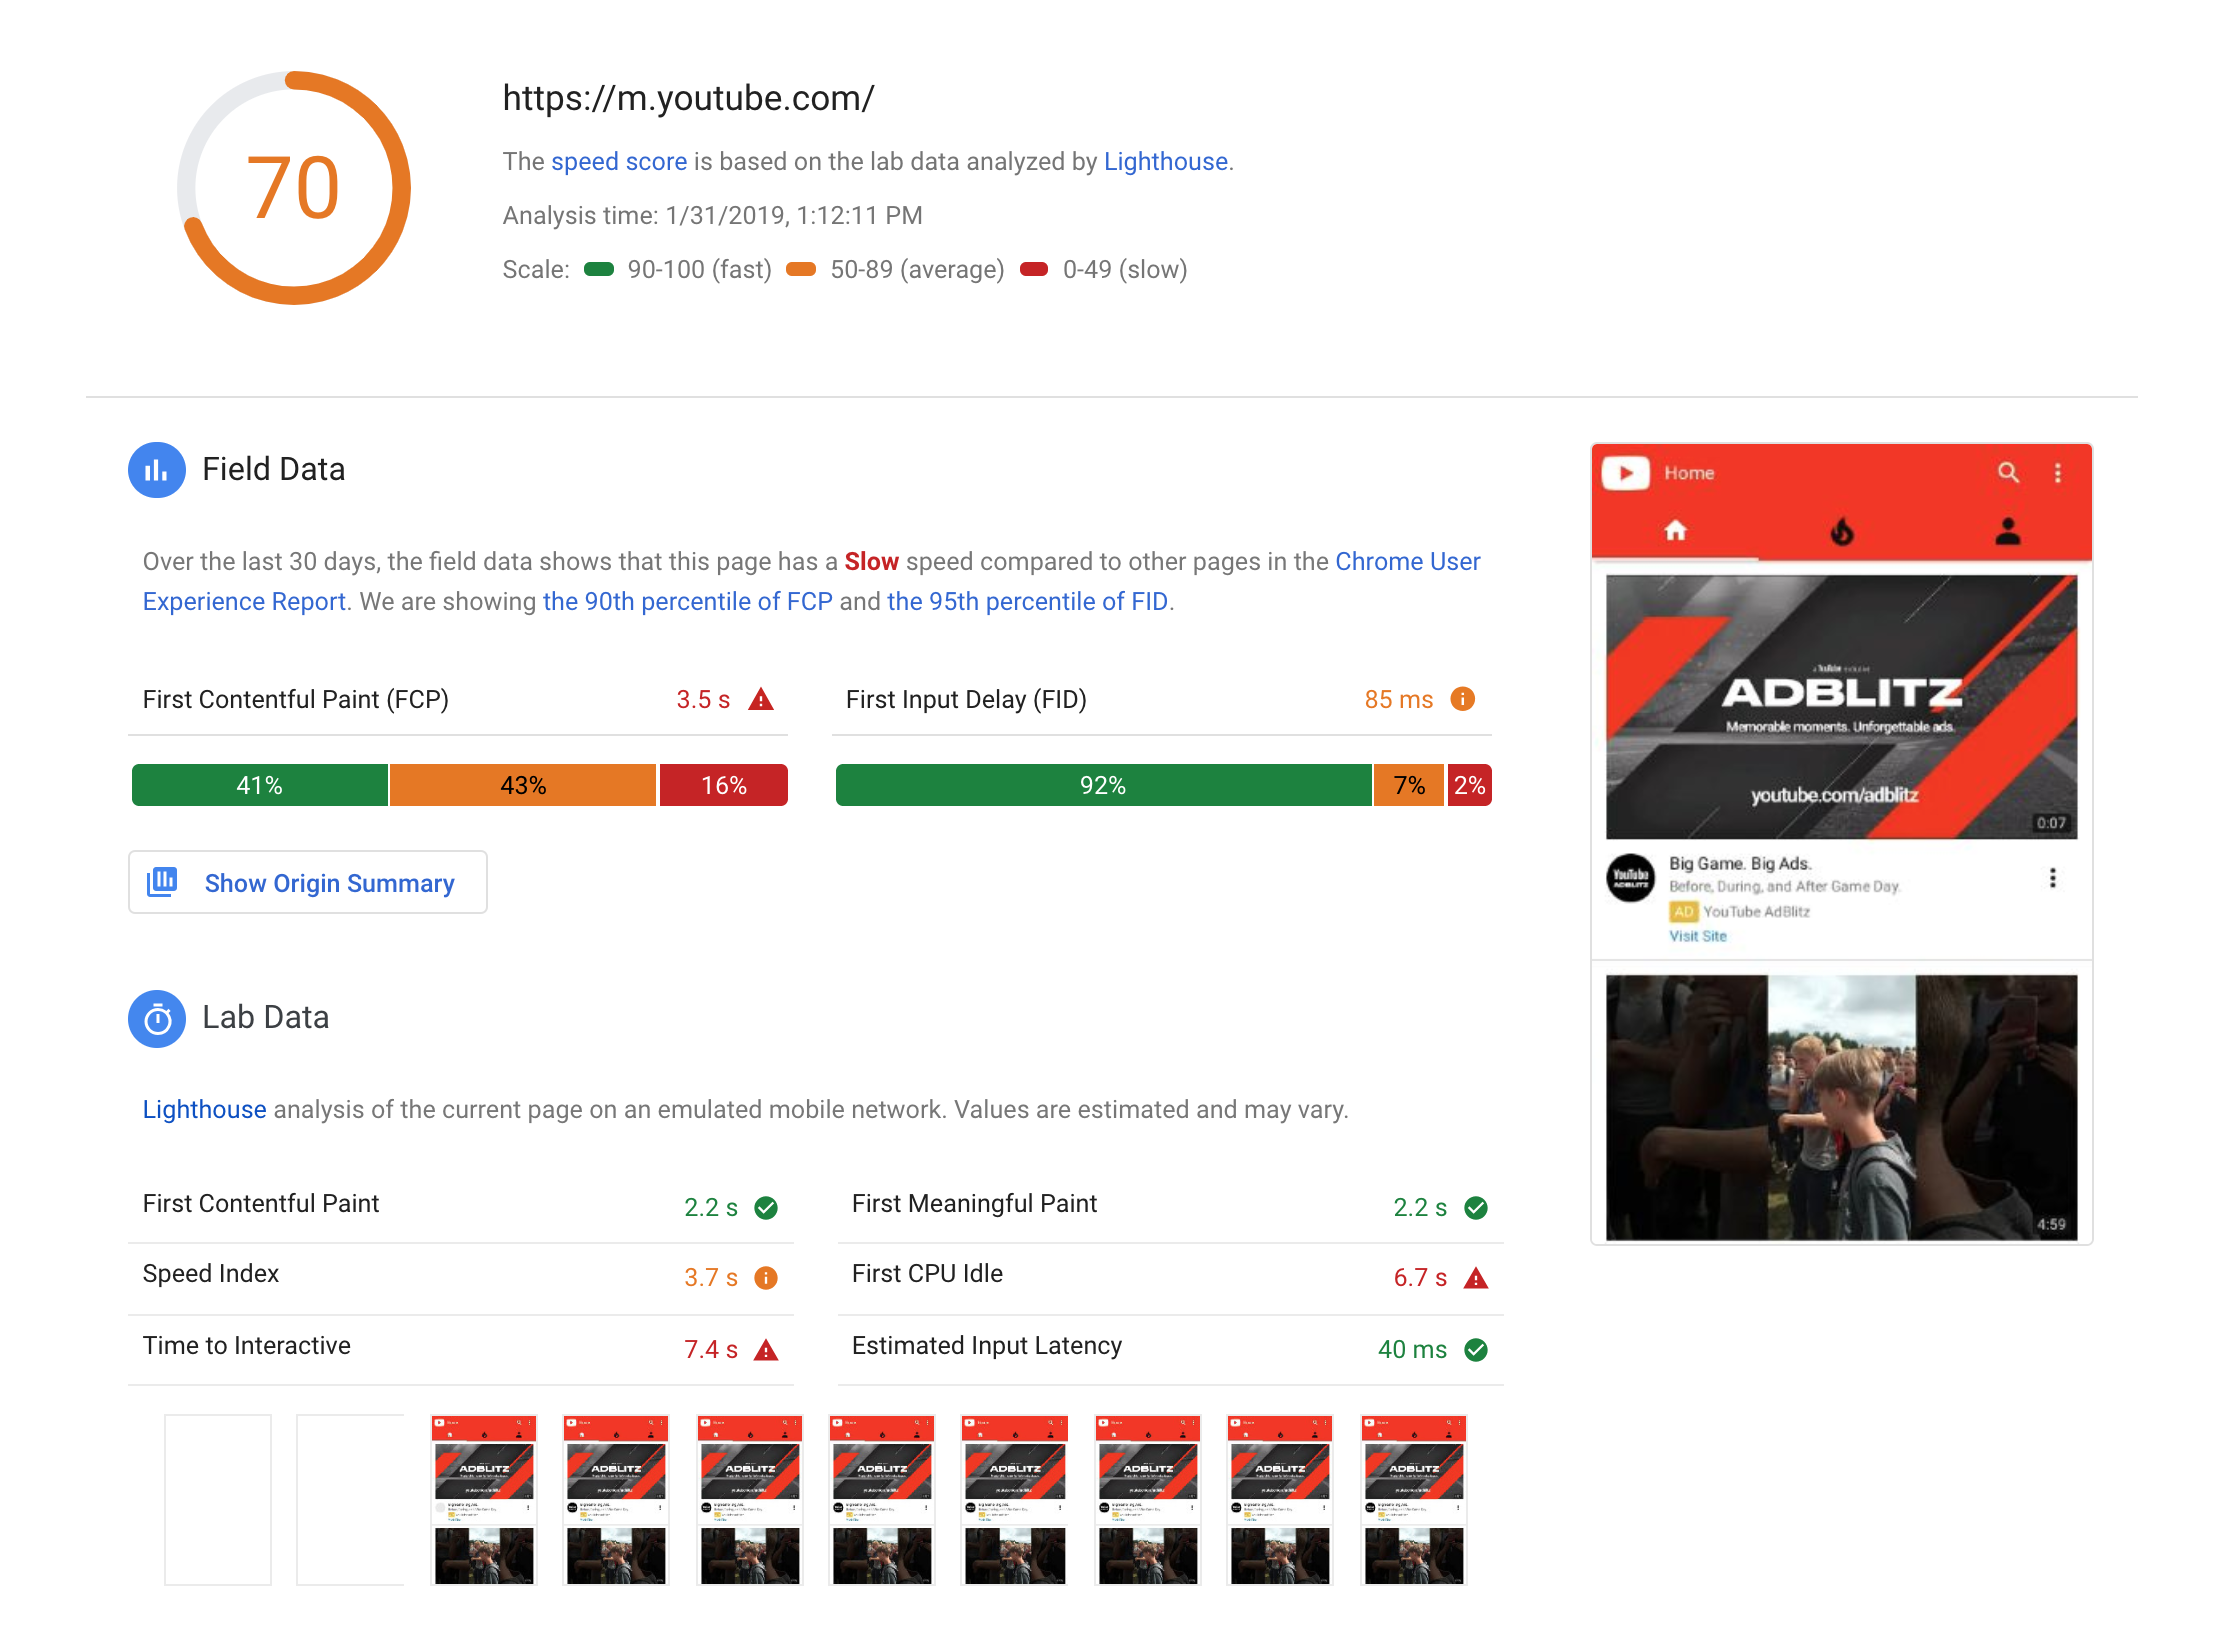
I'm not sure what you're seeing (there's a common problem we should probably develop some UI around where folks type in a URL and then the perf score is skewed by all the redirects of typing in a URL manually which is unlikely to happen for real users from search/omnibox/links/etc), but in the run I just did, Youtube scores a 70.
That feels roughly about right to me on 3G. YouTube is pretty complicated and has a lot of JS and the team works to make things better and move this number up. 70s+ is a fairly respectable number, maybe there needs to be a color between orange and green :)
Amazon scores in the 30s. This absolutely feels right to me. The number of times I've tried to complete a purchase on Amazon's site on mobile before giving up and waiting until I got home has cost them dozens of purchases. It doesn't have to be this way either. Alibaba scores in the mid 70s with basically the exact same challenges. Is getting in the green difficult? Yes, very. It basically means there's not much impactful work to be done on performance, move on to more pressing problems. This will simply not be true of many sites. Do some of the business constraints placed on devs make it impossible for them to get 90+ on their own? Yes, and since we finally have the opportunity to communicate directly to business stakeholders with PSI, I want to find the most effective way to communicate in the report when the score is a consequence of those constraints, so the choice can be informed. What we have right now is a start, certainly with lots of room to improve, but simply sweeping glaring performance problems under the rug is also not an effective strategy for moving the needle. I'm personally much more confident in a score-driven approach, that measures how the experience is, than a rigid checklist of things to do. The checklist might be easy for folks to follow and see all green, but it doesn't get at the heart of solving many performance problems where they actually begin, the business. Disclaimer: Just to be clear, all views are my own. I don't speak on behalf of Google here or their plans for PSI. I am not a real Google employee. |
|
Try convincing a higher up, owner, or stakeholder that he cannot have both a 95 score and that background video/canvas animation/javascript functionality and then justify the scoring criteria. To add: The criteria push heavily for Google-specific technologies like WebP and AMP. Forgive us for SOME cynicism when seeing this. The big push from web 1.0 to 2.0 was all about 'more images, more interactivity', which means pictures and javascript; two things that Lighthouse seem to outright hate. And now, we're getting the push from 2.0 to 3.0 and it turns out those old Web 1.0 sites are what Lighthouse wants? C'mon. There's also a lot of other issues, such as the speed improvements under opportunities not being properly explained. As is right now, it looks like WebP optimization is so good, it comes with a flux capacitor. The score shifts every test, again, to a range of up to 20 points. And not just on sites I work on. On every site I tested, I can run multiple tests and get radically different scores. At the very least, if the score is going to vary that much, you should internally run a sample and average out a score. Pagespeed Insights and Lighthouse has issues, and 'simply sweeping glaring performance problems under the rug is also not an effective strategy for moving the needle. ' |
|
@BenPav Let's please not stray away from the original idea of this post. I understand your frustrations but it's not productive to bring in all kinds of unrelated matters that upset you. Doesn't mean you're wrong about those topics, it's just not productive to pile them into a giant discussion. @patrickhulce Thanks for the extensive reply, it's great to be able to discuss this seriously in the open. There's plenty to respond to, so here goes...
From my perspective that would be a bit overstated. I can only speak for myself of course but the world will not give up on performance. It's well on the radar as far as I can tell, and really no digital business can afford to ignore it too much. Instead it is specifically Lighthouse scoring at risk of not being taken seriously, for it misrepresenting performance.
My answer here will be a little complicated. First, in a large corporation, there's no such thing as "the business". One stakeholder in group A will complain that performance is poor whilst the other stakeholder from group B really needs that invasive 3rd party script that makes performance even worse. They're not a single entity. I can only speak for my own org, but yes, carving out budget and capacity for web performance is a challenge, even with reasonable stakeholders. Almost everybody has capacity constraints where development capacity is shared between new features, changes, bug fixes, and then non-functional items like performance, accessibility, security. It's not that you can't convince the business of the importance of performance, it's just one of 20 things needing attention. Even more challenging is stopping or blocking performance degrading features. Most web experiences are ran/owned by marketing teams. Which have marketing KPIs to improve, typically requiring hefty tools like A/B testing that degrade performance. Whereas I've been successful in carving out budget to improve performance, I'm not successful in stopping all such new degradations. It seems an impossible job to me. If you're thinking that perhaps tooling can highlight the performance costs of those individual performance-hostile scripts and convince them that way: nope, not in my experience. SpeedCurve has this feature. Showing the dramatic performance impact of these scripts in a clear overview does not trigger anybody to uninstall their script. Because within the scope of their job, it's considered essential. A tragedy of the commons problem.
I'd say businesses take action when something hurts (in a business sense) or is embarrassing. Right now, the score hurts in the sense that it is low for many but it's an abstract number only a performance engineer can understand. "Business hurt" means losing conversions. Intent to buy or buy actions, time on site, those kind of things. The "embarassing" part could be realized by directly benchmarking against a competitor. This connect is tricky though. Lighthouse is a highly technical tool now suddenly thrown in front of business stakeholders. They won't understand something like "your JS is 200KB too large". It doesn't work. They see the score and color and that's it. Explaining why it is red in business terms (not technical terms) I imagine to be difficult. But perhaps not impossible. I'm positive though that the current explanation does not suffice for business stakeholders, they don't understand the metrics nor the opportunities. Regarding your take on the scoring of the examples given. I'm sorry, but I can't agree. In pretty much all examples 80-90% of the audience has a reasonable to excellent performance on mobile. The overall conclusion can't be red, that's a major misrepresentation. Scoring so well for so many users is a great achievement. The score should be green overall, with some secondary way to indicate that for a minority of the audience, performance is poor. So the exact opposite. Your take that green means "pretty much nothing to do" is interesting. Makes sense as a dev tool, not as a business tool who will not take it as such. Furthermore realize that Pagespeed has a long history where the expectation has been much different as to what scoring means.
Of course, I would never opt for a model that ignores problems. Yet we need to size and communicate them in realistic ways. If 90% of users has no glaring performance problems, it should not be communicated as if the site as a whole, and thereby its full audience has these problems. To illustrate: 70% of our mobile audience is on Wi-fi.
In this discussion, I'm avoiding the checklist part to not make the discussion overly complex. Furthermore, the business won't read or understand it anyway. Its impact isn't as heavy as the general score. As for the score, I believe you can't express performance in a single number, although I know executives want it. That's why I'm a fan of more neutral metrics like how fast things render and become interactive (this one a lot trickier than rendering). When I show the business a video of rendering before/after, there's absolutely nobody that doesn't understand it. Expressing neutral metrics in a way the business can connect to seems the way to go for me. It has to be less technical than "FCP, first idle, etc"...nobody understands what that means. To wrap up my lengthy response: I above all protest against the overall score. It misrepresents performance as it does not reflect the audience correctly, not even close.
That's fine. I'm glad to converse about this with anyone. I'm not here to attack anyone, I care deeply about performance and I actually love Lighthouse. I'm critical on the current PSI integration because I care about performance, and I believe the way it currently scores is not productive for moving the needle. Don't consider me an enemy, I want the needle to be moved and I want Lighthouse to do well and to be taken seriously. |
|
If I had a bit too much strength in my words, I apologize, but I do agree with what is said here, that the issue is Pagespeed Insights is forward-facing, very public, and the overall number as a metric will cause more issues than solve. |
Very well put! Thank you for clarifying my handwavvy boogeyman of "the business" :)
I agree this is the biggest problem in my experience as well.
Sort of. I agree I've never had much success stopping a script from being added by protesting directly to marketing myself, and I don't think a tool validating me would have made any difference. However, I believe there is opportunity to take the fear of "hurt" from seeing the red score, and use it to point the finger at this disconnect of stakeholders to try to stem the tide of perf-wrecking scripts being added to pages, or at a minimum, get marketing to pass the concerns on to the vendor. If all of sudden 80% of engagements for an analytics product got pushback for performance concerns, the analytics product is going to have to do better on performance and then everyone using it across the web benefits. (Lots of thoughts on putting pressure on 3rd parties but that's another topic).
I agree. There's another tool that's much more explicitly business focused (https://testmysite.thinkwithgoogle.com/) which does a better job at this. I think part of the challenge too is that the audience for PSI is so mixed, and maybe the answer is explicitly asking what type of view the user wants to get, simplified vs. detailed?
My response to this dives a bit more into what I suspect might be philosophical disagreement, but I'd argue that the "80-90% of the audience has a reasonable to excellent performance on mobile" is a major representation. Allow me to explain what I mean. All performance numbers a site receives from real users are only the ones that survived page load, so all the users with a sufficiently bad experience to leave early are not counted. On top of it, most numbers are about sessions/observations, not the average experience for each unique user, and users with better experiences browse more; that's why we care about performance in the first place! I don't have the numbers in front of me, but if you take the US and the current throttling numbers as an example, IIRC it's at the ~80th percentile observation-wise but more than half of users are on that connection speed or worse at least one session a week. Final piece that complicates things are that there's often a massive difference in performance between repeat visits and first-time visitors. The power law applies to users and the most loyal visitors will generate most of your observations. Loyal visitors who visit often are the most likely to have pretty much everything cached, no DNS lookups needed, etc. Lighthouse always analyzes the cold load case, which is the worst case scenario, but also one of the most important to succeed. These are the new users the site is making a first impression on! A bad experience here could ensure that they never come back, thus further decreasing the representation of slow connection users. When you add all of this together, 90% of a site's metric observation values might be fast, but the new user experience can easily still be dreadful. Real user data should absolutely influence what lab conditions you should be testing under, but the complexities of analyzing real user data makes it very difficult to get an accurate sense of what the new user experience is like. I agree with your emphasis on tangible, objective metrics, and if I can't see any content for 8 seconds (CNN), it's just an objectively bad new user experience. Finally, I sympathize with reducing such a complex topic to a single number, but you hit the nail on the head "I know executives want it". At the very least I think this offered a great deal of meat for future work and additional perspectives on how the information is being interpreted. |
I totally support this goal and hope it would work this way. But I'm not seeing it: If everybody is RED, everybody stops caring. I'm exaggerating a little here, but not that much. If your competitor is RED, if tech giants are RED, if a hello world page isn't even green, RED is just the default. A site with really bad performance is RED and so is a site with relatively good performance...still RED. This remains my main point and objection. I totally align with the goal, just not with the scoring. Current scoring does not motivate businesses to improve, it motivates them to stop caring. It also doesn't motivate developers to improve, quite the opposite, it punishes developers even more. That group of developers that do care about performance and have to swim upstream to get anything improved, still get red as a result and will continue to have to explain all those questions.
Exactly. And to that I would add "historical perspective". Old Pagespeed vs new is a radical departure. It's the same audience as before I would imagine, it's just that their site that used to score greenish, now sucks.
Sure, and that will be a portion of the audience. 10%-20%, who knows. They may be in slow network conditions and have that cold load of the website. So the most challenging conditions. That doesn't mean scoring of an entire web property should be based on this audience. And right now that seems to be the case, or at least it is interpreted as such.
No it isn't. It's a bad experience for you. I just opened CNN on both my laptop and mobile and in both cases I saw content within a second. So it's fine for me. I obviously understand that I tested in great network conditions, but that's my whole point: audience matters and you cannot take the worst of the worst and take the score of that to represent the score of the entire website. Do you not see the disconnect here? CNN is scoring 2. That means it's hard to make performance even worse. It's like rock bottom bad. Yet then you open it and for a very sizable audience, it's just fine. So what will this score mean for people assessing and checking it? Nothing at all. It can't be taken serious this way. |
|
I recommend first off of changing the emulated mobile network to emulate the true mean average of mobile speeds in the United States of 27.33mb/s versus the 1.6mb/s it's currently set at. That in itself will move a lot of the sites in the red into the yellow and green. I think also green starting at 90 is a bit harsh. Also, the score changing repeatedly. These are things that affect the tool's credibility. I have demonstrated this to stakeholders, by running the same site 5 times in 5 minutes and getting a score that changes in the range of up to 20 points. Want to know the stakeholders' response to this? "This thing is worthless and the number is arbitrary". If you had it poll the site multiple times on the mobile score in one test, and do a mean average, that would eliminate this issue, or at the very least lower the effect. |
|
I have to agree with most of what @BenPav and @fchristant are saying. For the "real world" the cut-off for a "green" score is a bit too high (should be 80-85 in my eyes). Also, you definitely should consider moving to a more realistic network throttling - see https://www.opensignal.com/market-analysis for clues. I myself opted to go for a ~1mbit up, ~6mbit down and 75ms RTT throttling on mobile and none for desktop (cable/wifi). If I'd run with the Lighthouse defaults I'd have a very hard time convincing potential customers (most developers even) to invest in performance, since they don't find the numbers to be realistic - and rightly so. Also it might be a good idea to push/market connecting a real mobile phone to LH, since the simulated/emulated CPU performance vastly differs, depending on the host's CPU etc. I also second @BenPav's proposal for generating average numbers for multiple runs in order to decrease variance (similar to what PWMetrics is already doing). Inconsistent data hurts trust in tools and people a lot - and I should know, having a web analytics background and quite a bit of experience with flaky reports/data 😉 |
@fchristant, my take on this is that you've pointed out a behaviour that metrics absolutely should highlight. People observe a wide range of experiences on the web. Those experiences, as you know are due of a lot of factors, including, speed of device, network, geographical location, dns and more. As such, metrics that are able to describe a range of experiences are required in order to really understand what users could experience. CNN is a notoriously slow site when tested on mobile devices, on slower connections, especially so with no ad-blocking software. However, on a fast desktop, it seems more than ok. At Calibre, we suggest that customers always throttle network to some degree, and always test a range of devices so that they can get insight into the spread of metrics. I know in terms of Pagespeed insights your objection is that the scoring mechanism is harsh, or feels a bit over the top, and I get you. It probably is. What I've noticed on this thread is that the scores are typically 20% lower than tests done on local hardware, which I assume is fast desktops on fast connections. Pagespeed's "desktop" connection is throttled at "Dense 4G 25th Percentile". Are we comparing apples to apples here? |
|
@benschwarz Thanks for chiming in.
Fully agreed, and my take is that the most "common" experience should be leading or at least very influential in calculating an overall score. Right now it seems a minority experience (rock bottom mobile conditions) are decisive for the overall. I consider this incorrect, misleading and very counterproductive for those sites where the vast majority of mobile users do get a reasonable to good experience.
I'm fully in favor of throttling. Every modern web monitoring tool uses throttling. I'm also on board with taking the most challenging mobile conditions as a default for measurement and improvement, for the simple reason that you'd typically have the most meaningful performance challenges there. At work we measure but ignore 4G and up, because both problems and improvements surface at 3G and lower. I'm against taking this throttled rock bottom experience and using it as an indicator of overall performance for a web property. As for CNN, I'm sure it in many ways is an extreme example of a website not optimized for a mobile-first world. Yet if you check my original post, note how pretty much any website is deeply in the red. And CNN seems to score the lowest of them all. I'm not sure if it's the best example to discuss scoring. But maybe it is. I just ran it again. The score was 2. According to the report, over 50% of users had a FCP of 1-2.5s. Which is excellent performance from a rendering perspective. The other half gets a FCP of > 2.5s without specifying exact numbers. Surely a portion of that would be users facing a FCP of 2.5-5s which can still be considered reasonable performance for a cold visit of such an "extreme" site. So by rough estimation, it could be up to 60-70% having a reasonable to excellent performance. How does that lead to a score of 2!? Ultimately, this discussion is about how the overall score is perceived. When I see a score of 2, I'm thinking performance cannot get worse, most users cannot use the site at all, will leave, and you're about to go bankrupt. In PSI, a score of 2 means 60-70% have reasonable to good performance. That's a gap in perception, and not a small one. More like a crater. I still do not have any serious answer for a business stakeholder wondering why we score in the red. Here's my answers at this point:
Not the answers I wan't to give but I'm serious that I don't have better answers at this point. |
|
A lot of the commentary I'm reading here about the weaknesses of the measurement ignore large swaths of the earth who might otherwise buy your stuff or services if they could access your site. Google addresses, distinctly, that audience (because it's google's audience). Their specific performance requirement, and that's what is captured by lighthouse, is "Awesome. Globally." So, always always always you should be taking the performance recommendations with a grain of salt the size of Google's global datacenter deployment. They also will always prioritize things that help their largest account holders -- large+global ecommerce companies and brands (the ad buyers). None of the above means we can't use the metrics, but if you're not describing the context to your stakeholders they're being misinformed about what the number means. That actually, as the technical experts here, is our problem. We're failing to communicate effectively the business impact of long PLT/TTI. Google's trying to do it with an idiot light (imperfect as those ALWAYS are). Personally, I'm with the "destroy millions of investments, start over". Too many sites load too much stuff. Simple and clear problem description confirmed by lighthouse's metrics. Sites that decide to structurally tackle that problem are rewarded with more sales and increased market share. Also simple and clear. As far as a way to improve the usability of lighthouse, and thus perhaps the credibility, I would love to see lighthouse ship different profiles for page load metrics -- ecommerce separated from other concerns like blogs, for example. And perhaps adding a 4g profile to mobile evaluations. |
|
"A lot of the commentary I'm reading here about the weaknesses of the measurement ignore large swaths of the earth who might otherwise buy your stuff or services if they could access your site." I think that statement is too strong. I can only speak for myself but nowhere did I say that part of the audience doesn't matter or can be safely ignored. What I'm saying instead is that if for 20% of your audience the experience is slow, it should not drop to conclusions to label the entire site as slow. That's a huge misrepresentation of the factual situation. "always always always you should be taking the performance recommendations with a grain of salt the size of Google's global datacenter deployment" Yes, that seems to be the current situation. To illustrate, at my employer we run mpulse (RUM) on millions of pages on a site deployed in 80 nations. For 70-80% of our audience, numbers are good to excellent (TTI < 4s on a cold visit). Then we open PageSpeed Insights and the entire experience is shit. So yes, I'm taking it with a grain of salt. When asked by marketeers and business stakeholders why this enormous gap is there, I current have no answer but to tell them Pagespeed Insights is skewed, unreliable, and not even close to real world performance across such an audience. That's not the answer I want to give them, and I don't believe Google build it only for themselves. I want Pagespeed Insights to be useful for business, and I can only expect Google wants the same. Interests align. "None of the above means we can't use the metrics, but if you're not describing the context to your stakeholders they're being misinformed about what the number means." Agreed. But note that in large companies, marketeers and other stakeholders self assess using PageSpeed Insights. There is no performance engineer at their desk explaining how to interpret results. Pagespeed historically has always been a hit-and-run assessment that requires little skill or context to understand. This is no longer the case. "Personally, I'm with the "destroy millions of investments, start over". Too many sites load too much stuff. Simple and clear problem description confirmed by lighthouse's metrics." I'm in agreement that many websites have lots of room for performance improvement, but you can't base such a rip and replace decision on lighthouse metrics. The metrics are nihilistic and unachievable. Let's take the extreme example of CNN again. According to Lighthouse, a score close to zero. So that has to mean completely unusable, throw away and start over, right? I'm sure it's an anti example where they are doing everything wrong, performance-wise, similar to wired.com. Despite all of that incompetence, it STILL performs well for a portion of the audience. Even a poorly engineered site can perform quite well for a vast majority of the audience. Another angle: 90% of the web is old and will never be changed. Yes, I made up that number, but I think it can't be far off. What are we going to do, give the entire web a 0 score and de-rank it? I'll also repeat my hello world test: literally a hello world HTML file deployed on a world-class CDN (Akamai). Score: orange. Need I say more? As for your profile idea, personally my main gripe is with the overal score/color as that is about all a typical user (marketeer) would look at. I think that scoring should be weighted on audience. |
Would you mind filing a separate bug report with this URL @fchristant? |
|
@patrickhulce Sure, will check it again when I'm back at work, don't have the CDN credentials here. |
|
@patrickhulce Just to let you know I re-checked my hello world Akamai example. I cannot reproduce the orange scoring anymore. A few months back, it scored orange with a FCP of 2.7s, now it scores 100 and in green. Not sure what changed, but no new bug to report from my end. |
|
I want to understand question mark on result. |

|
After more than a year nothing has changed, and actually the situation is even worst. Lighthouse and PageSpeed are today completely useless. I'm astonished about the level of deafness that this team and Google is showing to the world. today the score of youtube is 33. most of the js,css I should remove or change is facebook or google (yes included your fonts) also thank you for the suggestion to serve all the images in webp, so my customer will lose 20/30% of the users. on the positive note: pagespeed is so discredited that even SEO agencies and managers now know how unreliable and unrealistic it is, that it's so easy to skip any criticism about the performances. Often it's enough to show the performances of google sites as well. I wonder if these guys have completely lost touch on reality or the project may have been gone rogue by itself. |


|
@giona69 Well, apparently in past few days someone "improved" Lighthouse/PageSpeed so that our mobile scores went from ~55-60 to ~20-25, desktop from ~85-90 to ~55-60. The website loads in under 2 seconds on a 2 years old mobile phone over 4G, cold visit, no browser cache. LH/PS claims it takes 10-12s to load. (And to make things worse, apparently,. GTMetrix is now plagued with LightHouse as well.] Ok, I give up. The numbers provided are just completely useless and out of touch with the real world experience. Perhaps they are testing on dialup from Antarctica with Windows CE phone. No idea. This tool has no credibility whatsoever. |
|
The prevalent problem is every time I bring up these concerns with other developers, I'm told a version of "GITGUD!", with the implications that my own skills are the issue, not Lighthouse. When I actually sit and go over things with the other devs, specifically working off a CMS like Wordpress with plugins that cannot be dequeued easily or with code that should not be modified, THEN they go "Well, uhm, Lighthouse is just meant to be a tool for developers and doesn't really..." |
|
i'm very much late to the party, but I'm glad to find similar opinions. I have to vent here a little bit. I'm very-very frustrated whenever a client of ours discovers Pagespeed Insights. "Oh no, mobile usability is in the RED!! We only have 20 on that!!" - meanwhile, the whole site is lightning fast, but our scriptfile has "unused javascript". Well, duh, some of it is not used without you hovering or clicking on an element. Some of it is not used unless you're on a certain subpage. But I'm not going to segment the script out to every subpage, because then it would have to load a dozen different javascript files when you're navigating throughout the site, instead of caching just the main one on the first load. It also complains about unused scripts in google tag manager, or facebook sdk? How is that my problem??? And how is this a big enough issue to push the entire website in red? It's even worse when a client decides to contact a SEO agency in the matter, who then immediately points at these big red numbers as a huge issue. Meanwhile, the first page of Google results to very powerful keywords are nothing but websites with ratings of 5 or 7. The SEO agency's own site is on 12. Then what exactly are we talking about here? It feels like they are laughing at us behind our backs. If anyone else is annoyed and happens to find this thread, here is my advice, after years of this fight: shut these requests down. Do not worry about it. Spend maybe an hour on the issues you can fix (like minimizing your scripts and cache-control), and move on. It can be a crazy amount of work-hours just to improve a made-up number. Not to mention those occasions when you fix something, and yet the score goes down. |
Do what I do: Run 10 tests in a row with a stakeholder sitting right next to you and put down the scores each time on a piece of paper. The will see a shift in the scores of up to 20 points. The reaction is alway the same: "This number is arbitrary and doesn't mean anything" |
|
Thanks all for the discussion and feedback. I'm going to close the issue now as I think the point is made well enough. To anybody from Google if still reading along, this issue is not a variability issue (variability is another issue of PSI, but not the issue I started in this thread). It's a scoring threshold/calibration issue where you take the most pessimistic measurement conditions possible, and then represent the outcome as being the "mobile performance" of a website, and to do so to a non-technical audience. Whom will 100% interpret it the wrong way, and cause endless escalations and counterproductive behavior. That's 100% on you, Google. You're putting the wrong number in front of the wrong audience, and leave us to fix this mess. Two years later, PSI is as confusing as ever. The main takeaway number is casino red, and largely based on weather events. Then directly below it, where a sane and logical person might expect some drill-down or explanation of said red number, is field data. Field data. Seriously? A marketeer is supposed to understand that the drill-down directly below the top level score has absolutely nothing to do with it? If they even get that far? This leads to bizarre situations where a website scores 20-ish, deeply into the red. Then you read into the next part, and it PASSED web vitals scoring. So the report screams "performance bad" immediately followed by "performance good". But it doesn't end there. Then we switch context once more and are back to lab data. Now performance is bad again. And it explains why it's bad, yet mentions that none of the recommendations affect scoring. They obviously do, but whatever. This juggling of concepts and test methodologies is confusing and entirely lost on anybody but a hardcore performance engineer. It's a mess. To clarify, Lighthouse is excellent for its purposes and audience (developers). CRUX data is useful in its own right. The way this Frankenstein report manage to combine them in the worst way to the wrong audience is the issue. It's not a petty issue, I'm covered with scars from its ever-confusing effects and damage. Just recently I was summoned (again) to a MT (Fortune 500 company) based on yet another needless escalation triggered by PSI. I spent a full hour explaining how it actually is supposed to be interpreted. They were shocked and dumbfounded at how illogical it is. They didn't leave the meeting educated, they left it still confused. This would be on top of the typical random escalations coming in from all corners of the business where some marketing person or local business leader also found PSI and ran it. By the time I replicate the test, there's a 15-20 point difference and web vitals pass. But now it's of course on me to explain and justify that. A million times. It never stops. So there's no escaping from this issue. That's why increasingly, I want to be the person that doesn't know performance. Just like I suddenly don't know computers when that crazy uncle wants more free tech support. I guess we lost, so I'll close it. I might check back in 20 years to see if Google upgraded to a device from this century. |
|
mark |
Posting this as "other", it may be in the wrong place but it does say "post anything on your mind about Lighthouse" so I hope this is welcome here. If not, feel free to remove.
My discussion/feedback is about Lighthouse scoring and how it relates to Pagespeed Insights. In my experience, Pagespeed insights is traditionally used by business people and marketeers to quickly get a sense of the performance of a web experience. These people are often not (performance) engineers and therefore struggle to properly interpret results in the right context. They pretty much take the score number and color and leave it at that.
For these stakeholders, the current model leads to consistently awful results on mobile. A few examples:
https://developers.google.com/speed/pagespeed/insights/?url=cnn.com
https://developers.google.com/speed/pagespeed/insights/?url=https%3A%2F%2Fnew.siemens.com%2Fglobal%2Fen.html
https://developers.google.com/speed/pagespeed/insights/?url=youtube.com
https://developers.google.com/speed/pagespeed/insights/?url=https%3A%2F%2Fwww.dell.com
https://developers.google.com/speed/pagespeed/insights/?url=https%3A%2F%2Fwww.amazon.com
https://developers.google.com/speed/pagespeed/insights/?url=https%3A%2F%2Fwww.walmart.com
I'm not cherry picking here, it seems pretty much anybody is in the red as it comes to mobile performance. This paints a bleak picture as to mobile performance being awful and problematic across pretty much the whole web.
Which may not be entirely false, yet I believe it is overstated. The aggressive mobile-first tresholds of Lighthouse are not only aggressive in itself (as in, almost impossible to technically achieve), they typically apply to a minority audience for many websites, the 10-20%. If giant digital teams like Amazon or even Google itself cannot come close to green, what hope is there?
I believe the current scoring model is overly harsh, to the point where it is detrimental. If everybody scores deeply into the red and is unlikely to ever score into the green, I think the tresholds are counter productive. Even companies taking performance serious (as an example: last year our team shaved off seconds of performance) are "rewarded" with their website still being terribly slow on mobile, if Pagespeed Insights is to be believed. Followed by business stakeholders weaponizing the score.
I don't neccessarily disagree with the mobile web being pretty slow in general, nor do I disagree with Lighthouse putting an emphasis on mobile-first performance. I disagree with taking the most aggressive performance tresholds possible and widely communicating them as if they represent mobile performance to non-technical stakeholders.
I know Pagespeed Insights does contain some of the nuances to put the number in perspective, but as said, that's not how it is used. It's a business/marketeer tool, not an engineering tool.
In its current shape, I believe the way Pagespeed Insights reports performance is too harsh, miscommunicates performance to non-technical stakeholders, and as such the report loses its credibility and causes a lot of miscommunication or even frustration. Furthermore, targets seem unachievable in the real world, unless you start over again and create a 2 pager app, which is not what the web is.
I don't expect some kind of immediate solution, consider it food for thought. If everybody is red and green is impossible, I think it is reasonable to question the tresholds.
The text was updated successfully, but these errors were encountered: