Author: Colin Howe (http://www.colinhowe.co.uk @colinhowe)
License: Apache 2.0 license.
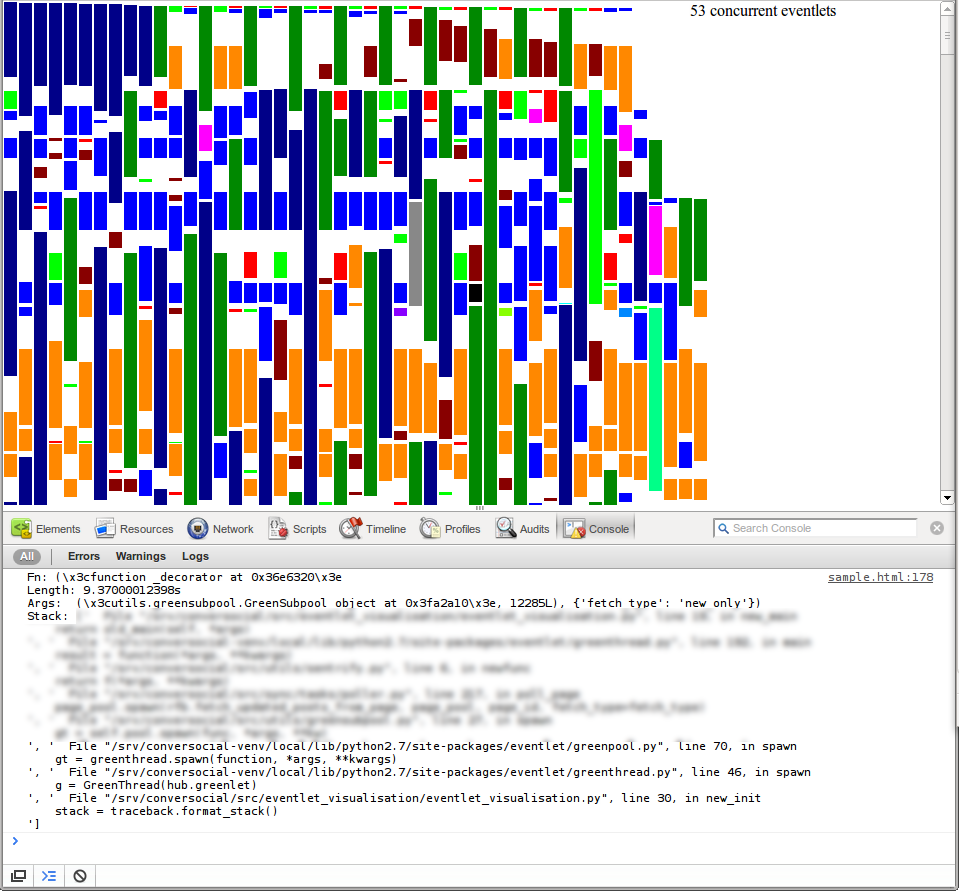
Visualises eventlet greenlet execution to help with diagnosing what a system is doing.
Example: https://s3.amazonaws.com/colinhowe-colinhowe/eventlet.png
Checkout this project to somewhere useful, e.g. eventlet_visualiser on a path reachable from the project you want to use it with. There is no setup.py on purpose as you will probably want to tweak the code to get the exact visualisation you need.
In the start of your program you need to patch eventlet to output trace to a file:
from eventlet_visualiser.trace import patch_eventlet
patch_eventlet(file('/tmp/eventlet.trace', 'w'))
Your program will now output trace information to /tmp/eventlet.trace. Note: only one program at a time should write to this file.
After generating a trace file you can do:
python visualise.py < /tmp/eventlet.trace > /tmp/eventlet.html
Now load that HTML file in a browser (I've only tried Chrome) to see what is going on. The generated HTML files can get very big so do be patient with load times.
Once all the blocks are displayed you can click on a block and useful information will appear in the console window (e.g. stack trace).
Any feedback or suggestions are welcome. Message me on github or on Twitter @colinhowe.
Feel free to fork!