matplotgrid is a tool for automatically creating a grid of independent matplotlib windows. The grid is defined by specifying the number of rows and columns, after which an arbitrary number of figures can be created. A new grid is created on another monitor if multiple monitors are available and the current monitor's grid has been completely filled.
I originally created this tool for use in plotting measurement data, where it can be useful to look at the data from multiple perspectives simultaneously (y-axis transforms, different x-variables, etc). An added benefit is that figures are placed in a consistent location and given consistent (row- and column-dependent) dimensions after every script execution.
This tool will be especially useful for those who work within the Spyder IDE (https://winpython.github.io/) and execute scripts via the Spyder console (a MATLAB-like experience). Additional information is available at https://h-gens.github.io/creating-a-grid-of-matplotlib-figures.html.
There is one dependency (https://github.com/rr-/screeninfo) that gets installed automatically if the following instructions are followed. Matplotlib is assumed to already be installed.
To install,
-
Clone this directory or download as a zip.
git clone https://github.com/H-Gens/matplotgrid.git -
Change into the matplotgrid directory and install into your distribution's site-packages directory (this also installs screeninfo).
python setup.py install
To uninstall: pip uninstall matplotgrid.
matplotgrid was written assuming the Qt4Agg backend has been selected. This is the default if WinPython was installed and one is using Spyder. Two of the more convenient ways to change your backend are:
-
Change the backend in every script. The first two lines of every script would be:
import matplotlib as mpl
mpl.use('Qt4Agg') # or mpl.rcParams['backend'] = 'Qt4Agg' -
Edit the file named "matplotlibrc" and set the backend to Qt4Agg. A copy of the file can be found in
<python-version>Lib\site-packages\matplotlib\mpl-data\. If using WinPython, copy this file tosettings\.matplotlib\.
Backends are described here.
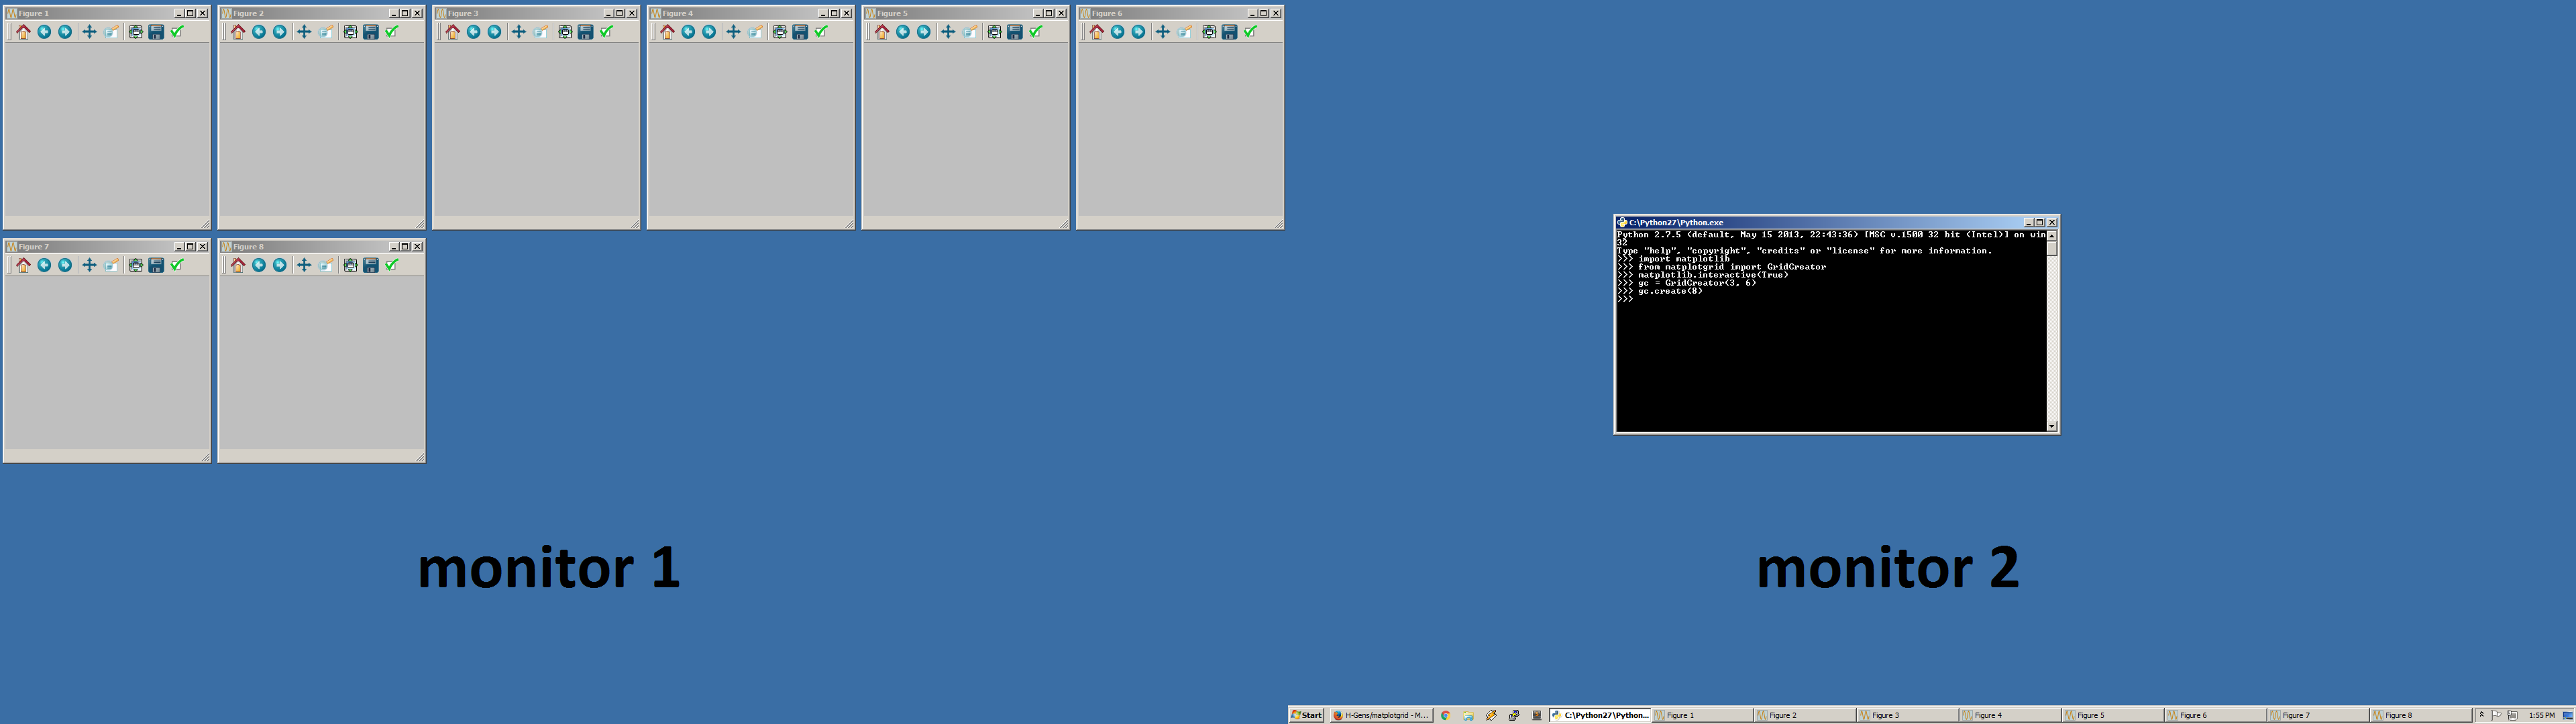
Example 1 - create eight figures.
from matplotgrid import GridCreator
# Define a grid with 3 rows and 6 columns.
gc = GridCreator(3, 6)
# Create 8 figures.
gc.create(8)
Example 2 - create four figures, numbered 9, 10, 11, 12.
from matplotgrid import GridCreator
# Define a grid with 3 rows and 6 columns.
gc = GridCreator(3, 6)
# Create 4 figures.
gc.create([9, 10, 11, 12])
The figures will appear automatically if using interactive mode (matplotlib.pyplot.ion() or matplotlib.interactive(True)). Otherwise, matplotlib.pyplot.show() will need to be called (my startup script for Spyder is spyderlib\scientific_startup.py, which turns interactive mode on automatically). See GridCreator.create()'s docstring for advanced options.