Sashimi plot - junction counts and location issue #538
Comments
|
Thanks for the report. I will look into it. |
|
@cbenoitp I cannot access the example.zip archive. Could you repost it? Thanks. |
|
Sorry! Here is the new link : example.zip. |
|
Thanks for the sample data and detailed instructions, it is a big help.
I'm looking at this now.
…On Tue, Jun 5, 2018 at 2:50 PM, Clara Benoit-Pilven < ***@***.***> wrote:
Sorry! Here is the new link : example.zip
<https://drive.google.com/open?id=1qwttyOXyFShmLW_CkNeAhiBcU4iwTA02>.
—
You are receiving this because you commented.
Reply to this email directly, view it on GitHub
<#538 (comment)>, or mute
the thread
<https://github.com/notifications/unsubscribe-auth/AA49HA46n8jE0Bakni7b5XjzFRXiwX21ks5t5tMQgaJpZM4T1PQw>
.
|
|
Thanks again for the test data and report. I have found the problem and
pushed a fix, it will be released on Monday as 2.4.11.
The bug is in combining junctions from both strands, if you view junctions
for one strand at a time it should be correct. Again the fix will be
released on Monday.
|
|
This is fixed in the current release (2.4.11). |
Sign up for free
to join this conversation on GitHub.
Already have an account?
Sign in to comment
Hello,
I'm using sashimi plots to visualize and confirm events of alternative splicing in my RNAseq data.
But I'm having problems with the sashimi plot in IGV. Indeed, I tried to generate sashimi plot with 2 versions of IGV and had discrepancies between the 2 versions.
First, I used IGV version 2.3.98.
With this version, I have a problem with the reads numbers shown on the junction. Each time, I load a new sashimi plot from the same region, the counts of some junction increase. It seems to only affect junction with high coverage and the counts for these junction seems to double each time we reload the sashimi plot or change the settings.
The first time I load the sashimi plot the counts are the following:
Then, after I redo the sashimi plot, I have the following counts:

Because I realized I wasn't using the last version of IGV, I then tried IGV version 2.4.10.
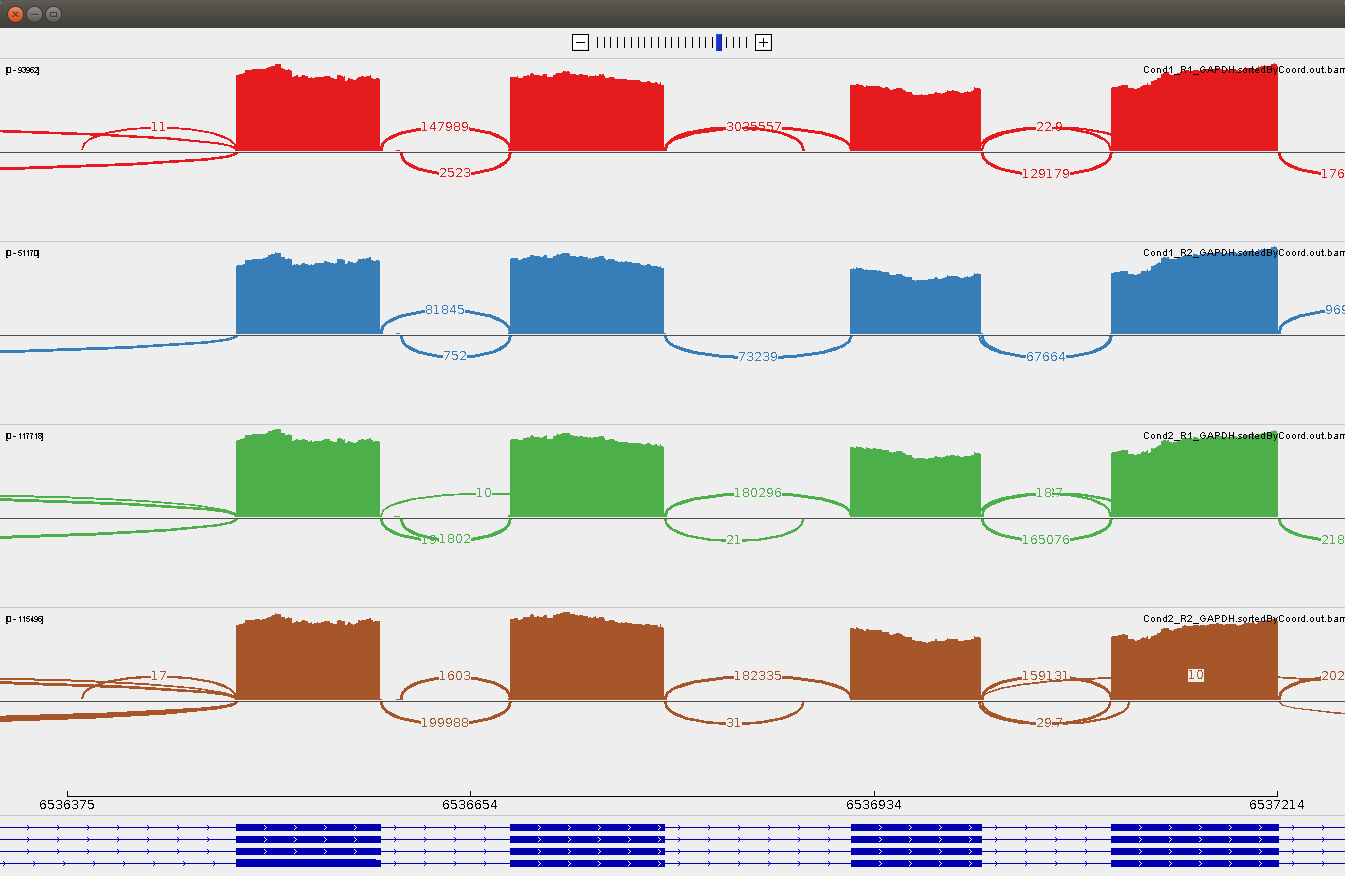
With this version, the counts of the junction don't change when reloading the sashimi plot. But this time, the position of the junction seems to be incorrect. They do not correspond to what we saw in IGV 2.3, neither to what we see in the alignment and coverage tracks.
Looking at the junctions, we can see they are misplaced (particularly comparing with the sashimi plots from the version 2.3):

Here are the samples to reproduce the bug: example.zip.
Workflow to reproduce the figures:
I'm using IGV on ubuntu 16.04.
Thank you for your help,
Clara
The text was updated successfully, but these errors were encountered: