high load average every 1h 45m #3465
Comments
|
Unless you have an input configured to run every 1h45m, there isn't any periodic tasks that would get ran by Telegraf. Is InfluxDB on the same system? |
|
I have standart config for telegraf and dont have special inputs. InfluxDB on the same server. Maybe Telegraf send data to InfluxDB and InfluxDB up load average? |

|
Also having this on my Telegraf servers (version 1.4.3, InfluxDB version 1.3.6). I have no specific periodic tasks configured to run every 1.5 hours, and I'm using almost default configuration with one HTTP listener input and two InfluxDB outputs. Is it something like garbage collection? |
|
Could you try using the procstat input to watch the Telegraf and the InfluxDB processes, this should allow us to see which process is causing the extra load. I think it could also be useful to enable the internal plugin, which will report the memory usage by Telegraf, and you could use the influxdb input to monitor InfluxDB. |
But wget "http://127.0.0.1:8086/debug/vars" works normal and get json |
|
procstat info |

|
Hmm, nothing appears to line up. Can you try to discover which process is causing the high load? |
|
I tried stop service telegraf and get data load average in script
and load average dont up. now try again |
|
I do "systemctl stop telegraf" and for 4 hours load average dont up even upper 0.9 as you can see clearly that the problem is in the telegraf or in using it together with influxdb |
|
I suspect it may be caused by a process that Telegraf is starting, or possibly a subprocess of InfluxDB, because when we monitored the Telegraf process there was no corresponding spike in cpu usage. Can you try to find the name of the process that is producing the cpu usage during one of the spikes? It might be easiest to just run top during the time period with the increase. |
|
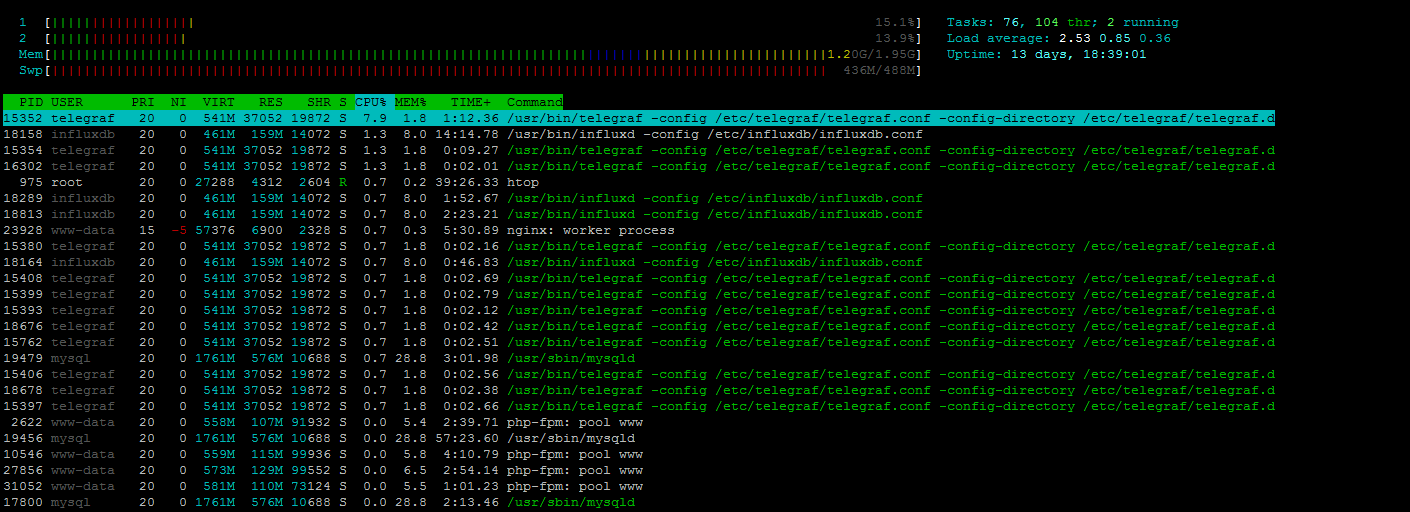
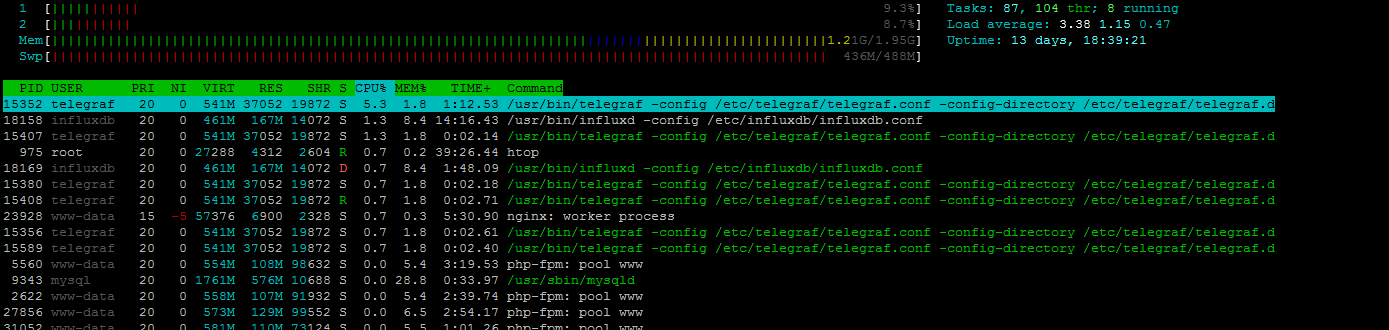
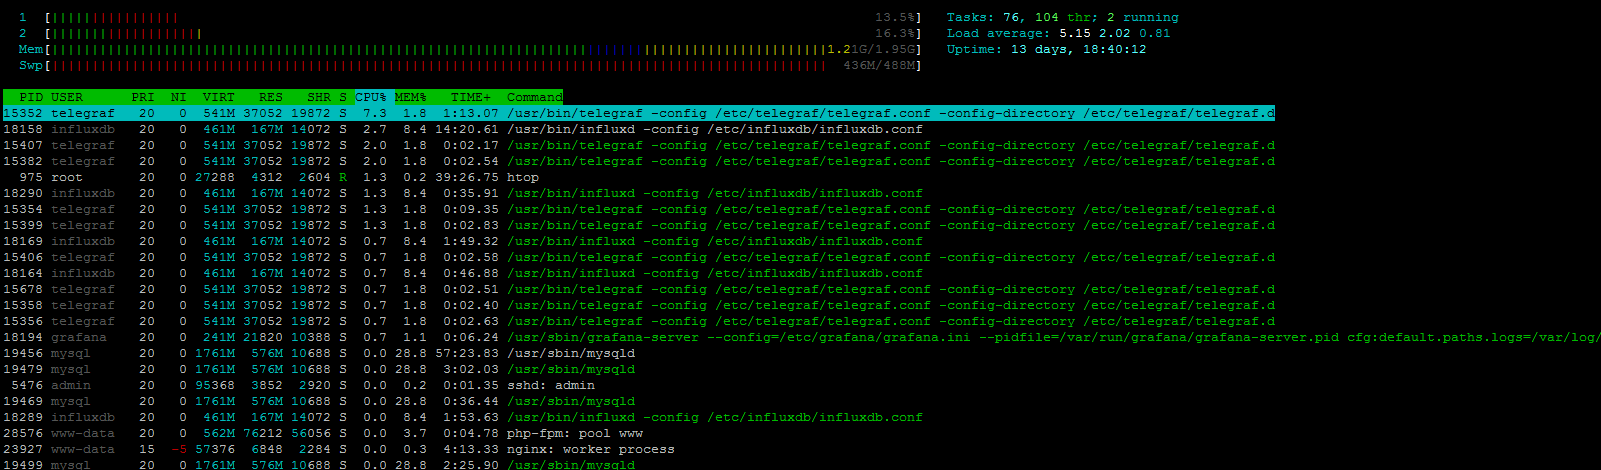
visually on htop program i see 3-4 influxdb and telegraf. I try do print screen htop in spike period |
|
on 2 minutes load average from 1 to 5
|


|
It looks to me that the load is not caused by cpu, telegraf is still only taking 7% as a peek reading, but I do notice that the influxdb process is often in state |
|
What I need do? |
|
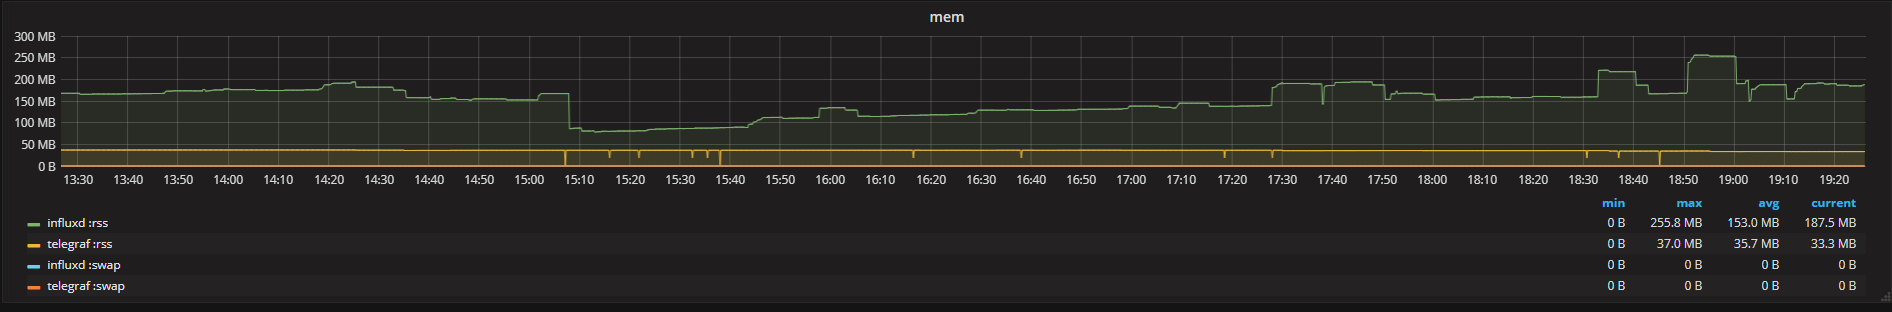
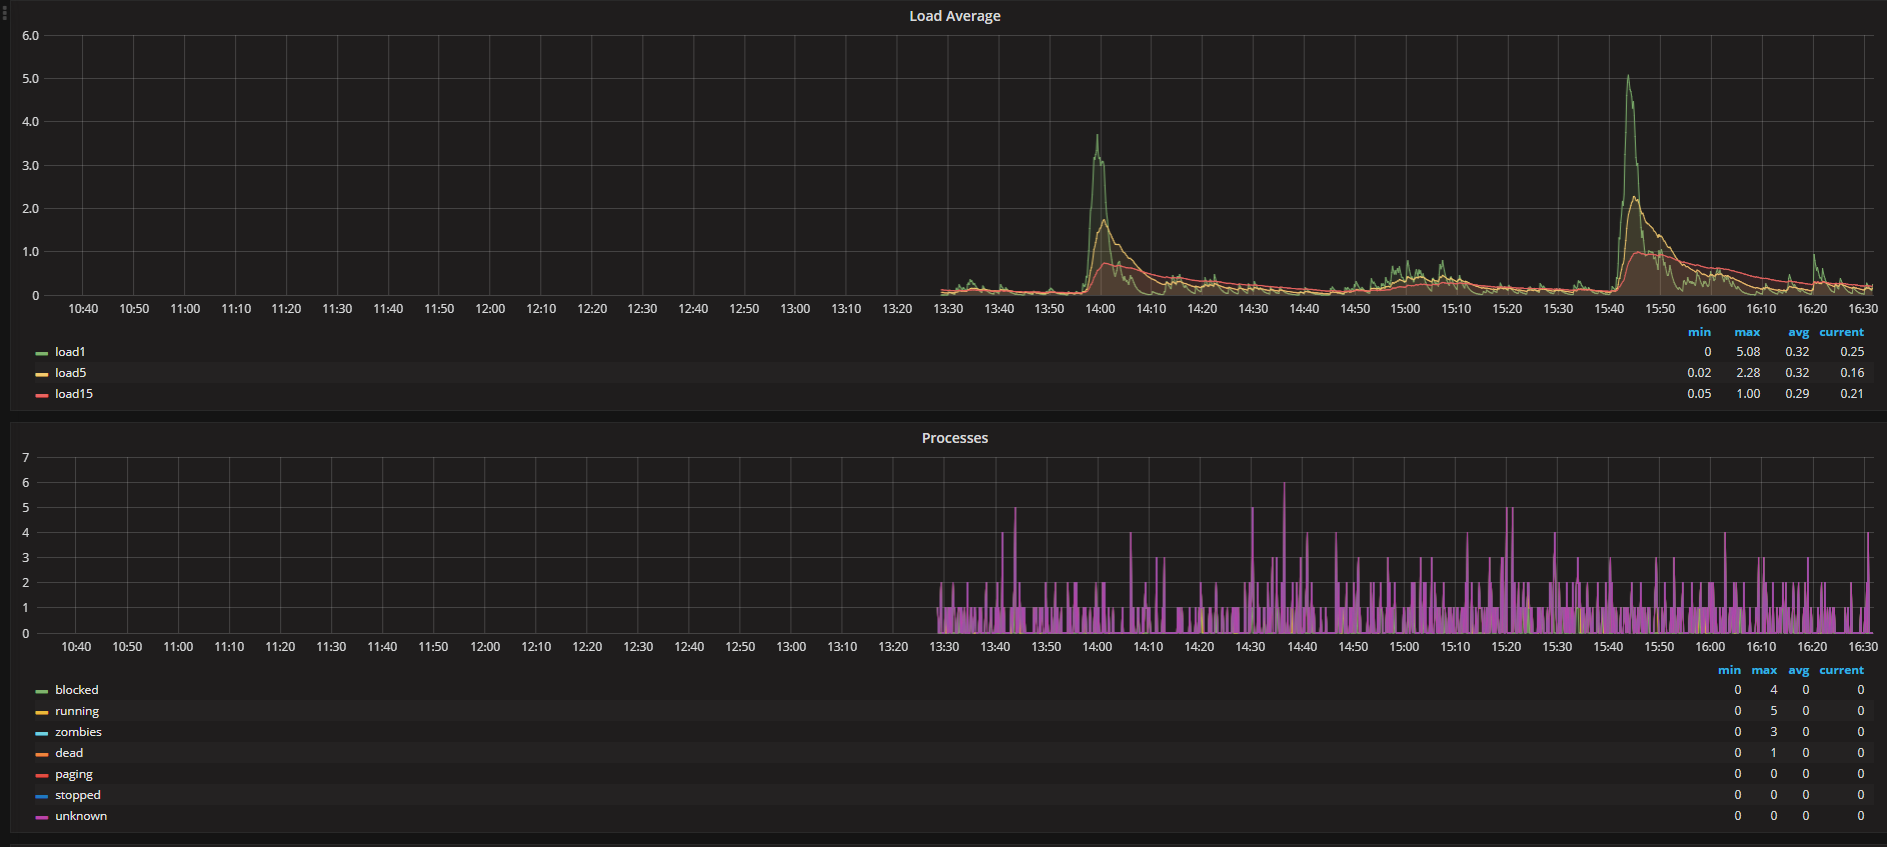
If you have it, let's take a look at the graph of the the |
|
that? |

|
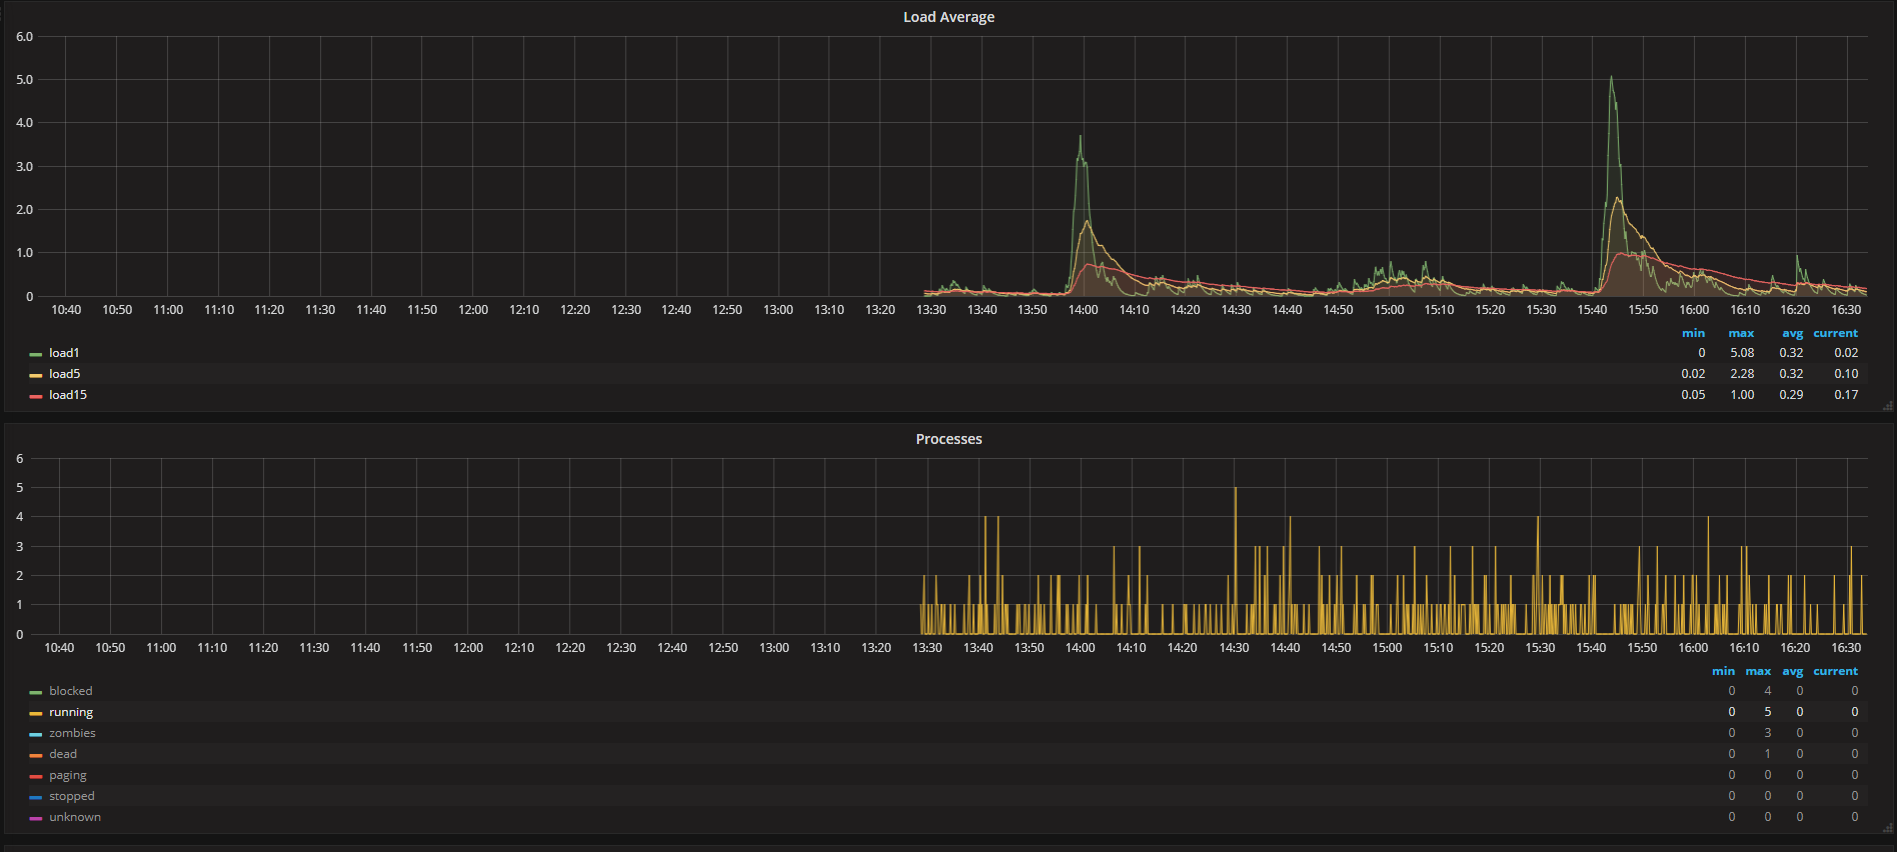
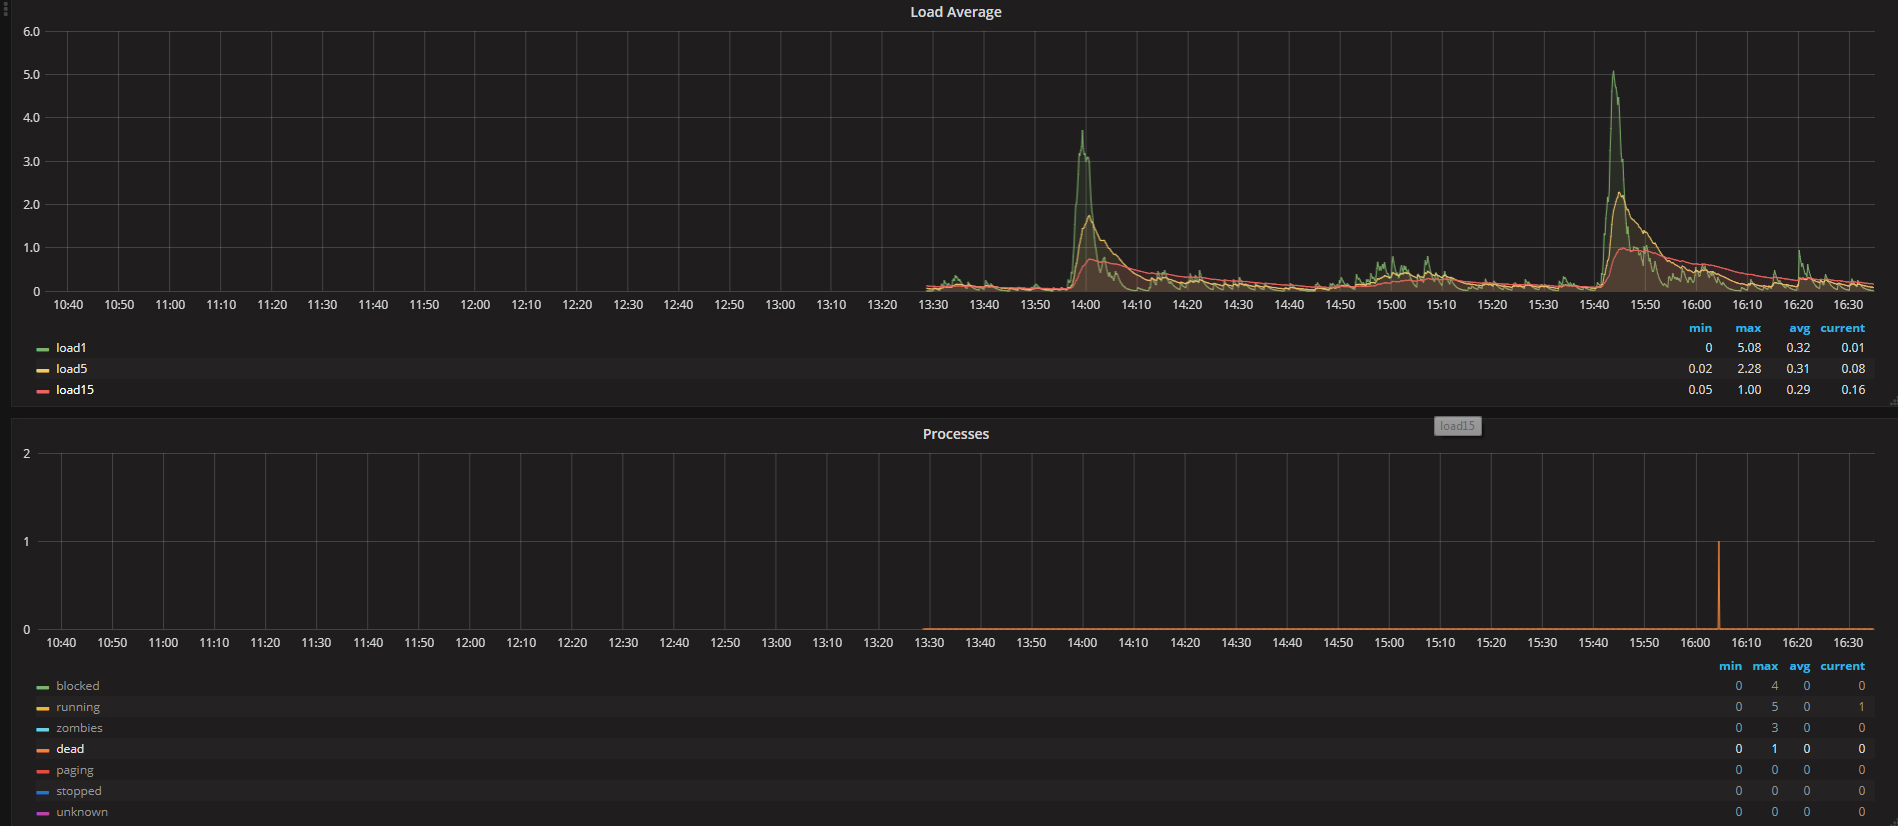
Yeah, can you remove total and sleeping so we can see the blocked processes? |
|
|


|
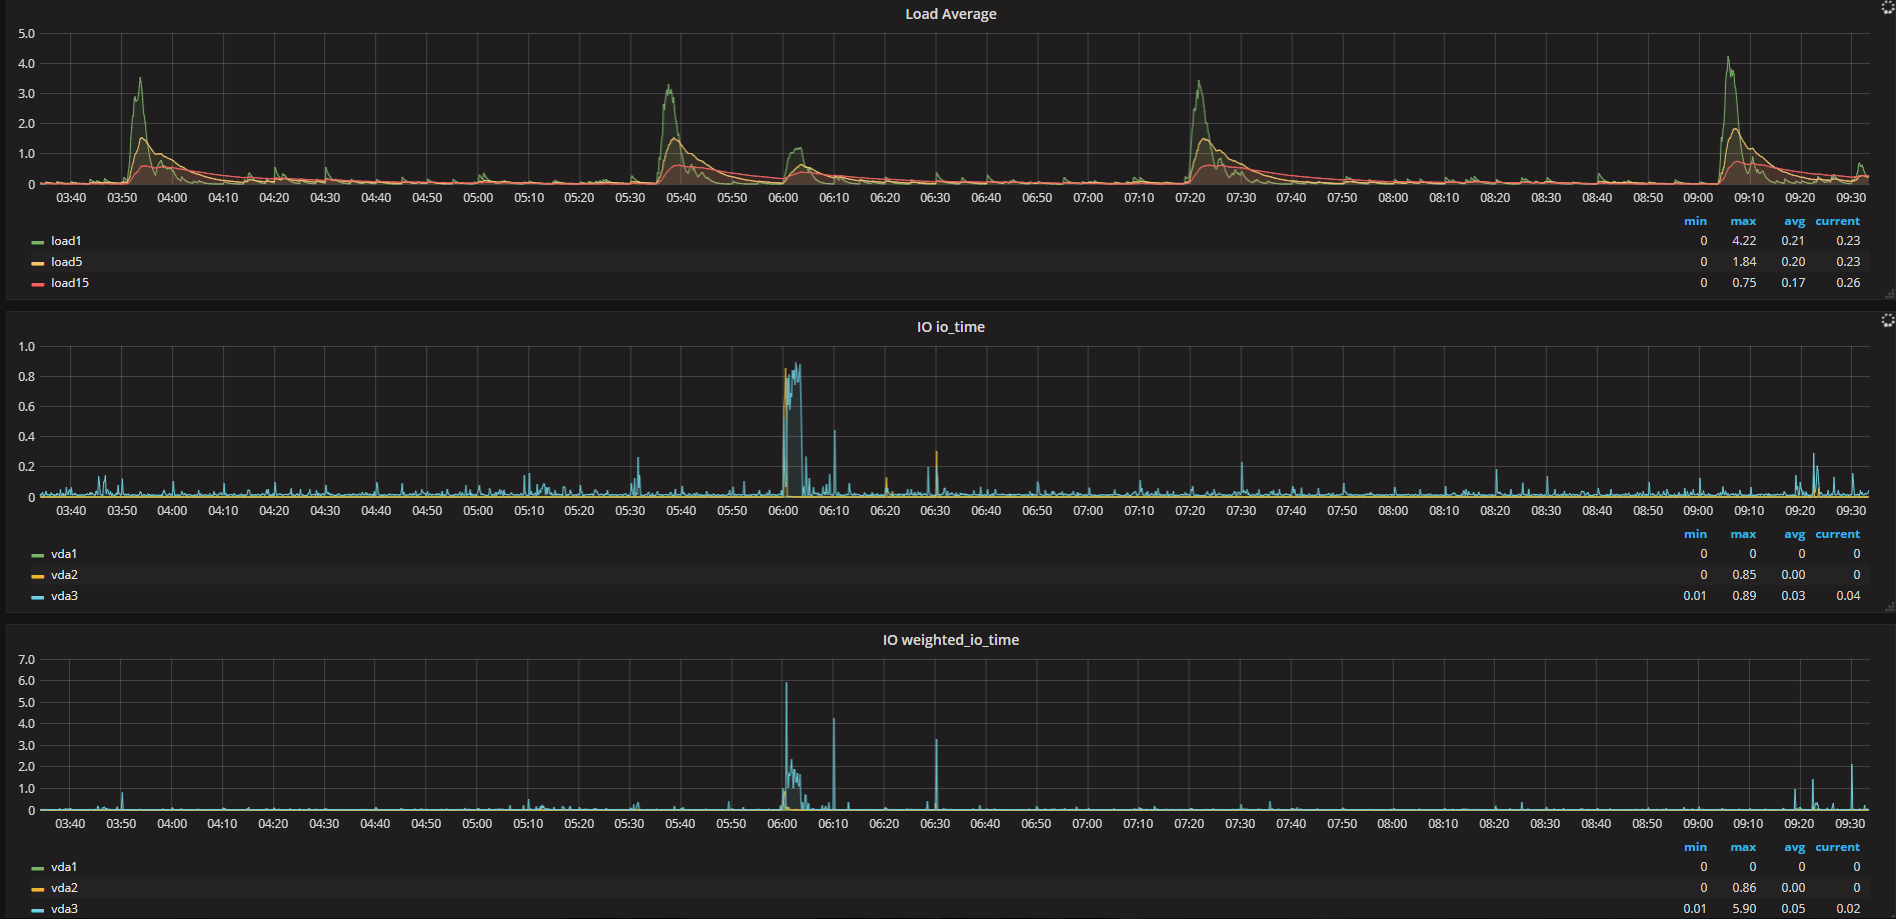
Can you try looking at these two sample queries with the diskio input. |
|
on 6-00 system did autobackup.
|
|
i have all default statistics and nothing not show problems exclude load average. if you contact this me on vk.com or facebook.com I may give you access to web grafana |
|
Who would have thought it could be so hard to track down the source of the high system load averages... It would be interesting to separate out the servers that Telegraf and InfluxDB are running on, is this something you would be able to try? My best guess is it has something to do with the InfluxDB cache writing. |
|
sorry, i have only one server. if you give connect to you influxdb I may send statistics to you |
|
my system Ubuntu 16.04.3 LTS [xenial] 4.4.0-98-generic on KVM VPS |
|
I think this is probably just normal behavior of InfluxDB, either writing its cache or perhaps compacting the data files. I would have liked to be able to find the exact cause of the load, but this turned out to be tricky, and I don't think it is something that we can solve in Telegraf anyway. You could try disabling some of the inputs, and see if this will result in an adjusted period between load increases. |
|
the more statistics the telegraph collects then more the load average in peak moment. if I turn off the collection of statistics then the load will be lost. but this is not normal when you collect a minimum of statistics the server is highly loaded. and very strange pereodic 1h 45m |
|
need I open ticket in influxdb forum? may be their specialists help me? or this favorably for buy cloud influxdb service? |
|
Thanks for opening the issue on InfluxDB, I'm sure they will be able to help you in more detail. If you have questions about InfluxCloud you can also contact sales@influxdata.com. |
|
I don't think so, it seemed too long between occurrences to be GC related and there doesn't seem to be much change on the memory usage. |
|
Should be able to see the last gc time by starting Telegraf with |
|
memory isn't always returned to the OS after a GC, as the assumption is the program will use it again. but the machines in the htop images don't have enough ram to account for a minute + duration of GC. GC also doesn't trigger unless memory is consumed so it could be a slow build up. another thing i find interesting that leads me towards other sources of load, htop is showing almost no CPU utilization. what about locks, or timers? |
|
this? |

|
or full log? |
|
after hour
|

|
After upgrading to 1.5.1 yesterday I have the same issue with all my virtual machines and the hardware machine itself. The interval is also 1h 45m but the start time is a little different on every machine.
|

|
Same issue:
This is idle physical system (16GB RAM, Intel i5-6400T, Ubuntu 16.04.3), running only telegraf (1.5.0). Similar effect I observe on another system (a bit more powerful), which is serving as proxmox node (though with very small activity). I have tried to find out what is going on during those peaks - but found nothing. No disk, cpu or any other activity, nothing that could cause such load (on second system it was above 4(!) - while normal is around 0.1-0.2). Context switches, interrupts, fork rate - no changes, only this ephemeral load. Used memory changes are within 500KB, no anomalies. Increasing collection interval from 10 to 60 seconds significantly reducing load, but it is still there (same interval). With collectd running on same system (instead of telegraf) nothing like this happens. |

|
Would be useful to know if it matters what plugins are enabled, or if the load occurs with any plugin so long as there is enough traffic. I think the best way to check would be to enable only a single plugin and see if the issue still occurs, if it does, enable another single plugin and retest. |
I checked it already, Load average have reducing load, but same interval. If collect very little data, then load average almost invisible |
Well, with single plugin enabled (system, obviously), the situation is even "worse":
Now I have constant load of 1. I do not believe that querying for system load every 10 seconds could produce such load... PS: After analyzing strace output, I am starting to suspect that all this behavior is not related to telegraf only - as it only uses futex/epoll/pselect/read/write call, and not so often. Most likely, this is related to how Linux computes load average based on process states, and several sleeping threads (depending on state and method) may cause such strange behavior (especially when user-space is involved - a case of futex). |
|
I am seeing the same behavior on my host where telegraf agent is being installed and it's happening every 7 hours. CPU load increases and triggers an alert (which I am also using zabbix to monitor this host) .. Hosts where I have installed telegraf agents are showing the same behavior...Updating |
|
@apooniajjn When this issue occurs there does not seem to be a cpu increase, only load average. Please ask over at the InfluxData Community site and I'll help you there. |
|
@danielnelson thanks .. yeah my bad I meant |
|
@apooniajjn If it matches this issue closely other than the period, then you can just use this issue. At this time it is unknown what might be causing the problem. |
|
@danielnelson yeah it matches closely to this issue except the period ... |
|
I just want to point out that 7hours = 4 * 1h45m 😉 |
|
I have the same issue but with collectd (and rrdcached as backend) (on Debian Stretch) instead of Telegraf: When searching the internet for |

|
Here's a good article talking about how this is calculated in the linux kernel and why it happens. |
|
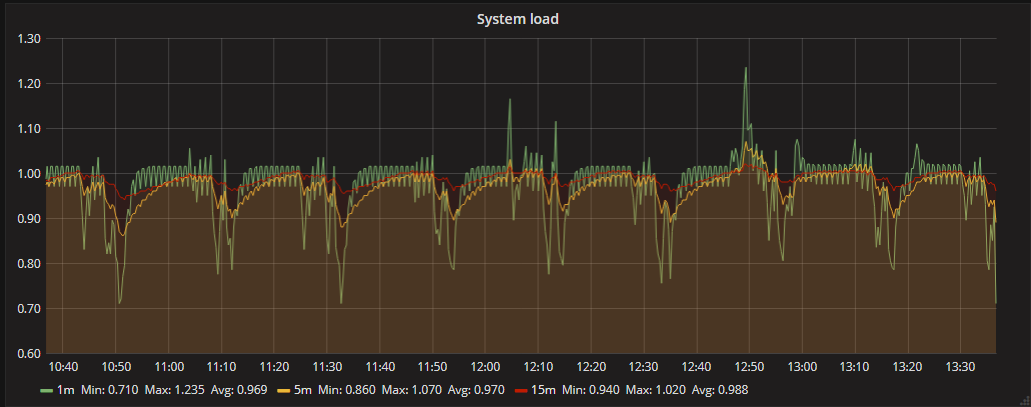
Very useful article, thanks for sharing. Based on that, we've changed "collection_jitter" from 0 to 5s. Here's the result: |

|
@gentstr I think that pretty much explains it, thanks for the link. Though I do wonder why in our case the interference occurs so frequently, and not every 14 hours since most users probably have a 10s interval. I'm going to close this issue since there isn't an action to take on our part, anyone who wants to reduce this artifact can use |
|
Was experimenting same behaviour and really liked the article explaining the artefact. Note that this machine (Intel NUC) is running a couple virtual machines each with telegraf installed. |
|
Faced the same issue with high LA every 6h 54 minutes. Will add this to the collection: |
every 1h 45m load average my server up to 3-4 (normal 0.2-0.5)
if stop telegraf service load average dont up every 1h 45m.
Why is this happening?
Is it possible to adjust the time or period?
telegraf v1.4.3
influxdb v1.3.7
The text was updated successfully, but these errors were encountered: