Suave Viz exists because there's a lack of good tools for exploratory data visualization. Existing tools require way too much effort to get a decent chart (ahem...ggplot) or trap you in some proprietary vendor's crappy dashboard UI.
Suave Viz solves that pain by giving you a dead-simple command-line tool for data visualization. Just pass some data in TSV format and Suave Viz opens a great looking, interactive chart in your browser.
It's built on Suave Charts & D3.js.
Yes. It's fantastic. It's like having a freaking data lightsaber that's even easier to use than successfully trolling Apple fanboys.
- Line charts
- Bar charts
- Scatter plots
- Histograms
- Download the zip from the latest release
- Extract the zip and add the bin directory to your path
For example: in your ~/.bash_profile
export PATH=$PATH:~/suave-viz-1.0.0/binThat's it. You now have the suave command on your path
All the examples below use data found in the docs/example-data directory. So you should be able to run these examples yourself.
Assume we have a TSV file of stock data: stocks.tsv
cat docs/example-data/stocks.tsv | head -n 10
date	close
24-Apr-07	93.24
25-Apr-07	95.35
26-Apr-07	98.84
27-Apr-07	99.92
30-Apr-07	99.80
1-May-07	99.47
2-May-07	100.39
3-May-07	100.40
4-May-07	100.81
Then to graph dates on the x-axis and prices on the y with the default line chart, we simply do:
suave docs/example-data/stocks.tsv 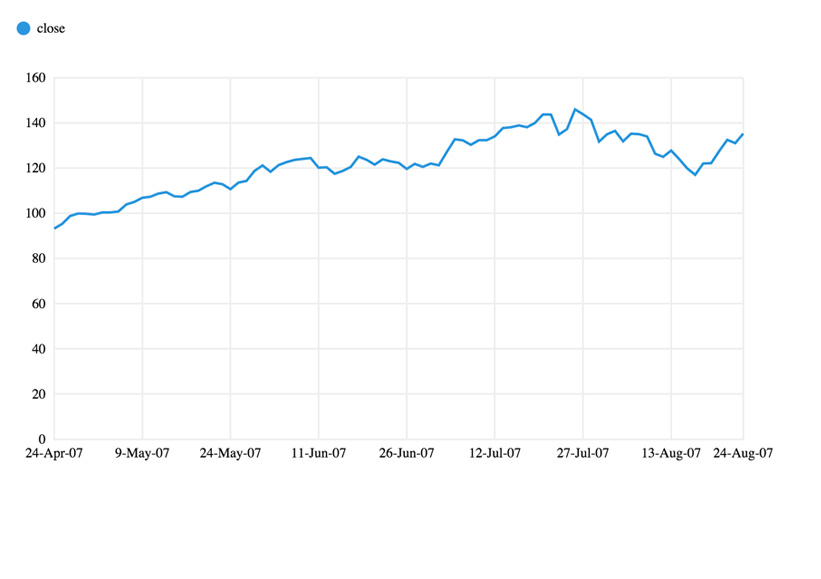
And if there were multiple stocks we wanted to graph (multiple lines), we'd format the data like this:
cat docs/example-data/multi-series.tsv | head -n 10
date	APPL	TWTTR	FBX
20111001	63.4	62.7	72.2
20111002	58.0	59.9	67.7
20111003	53.3	59.1	69.4
20111004	55.7	58.8	68.0
20111005	64.2	58.7	72.4
20111006	58.8	57.0	77.0
20111007	57.9	56.7	82.3
20111008	61.8	56.8	78.9
20111009	69.3	56.7	68.8
Then we'd chart it like so:
suave docs/example-data/multi-series.tsv

if we wanted a scatter plot of the same data instead, we'd simply do:
suave example-data/multi-series.tsv --chart scatter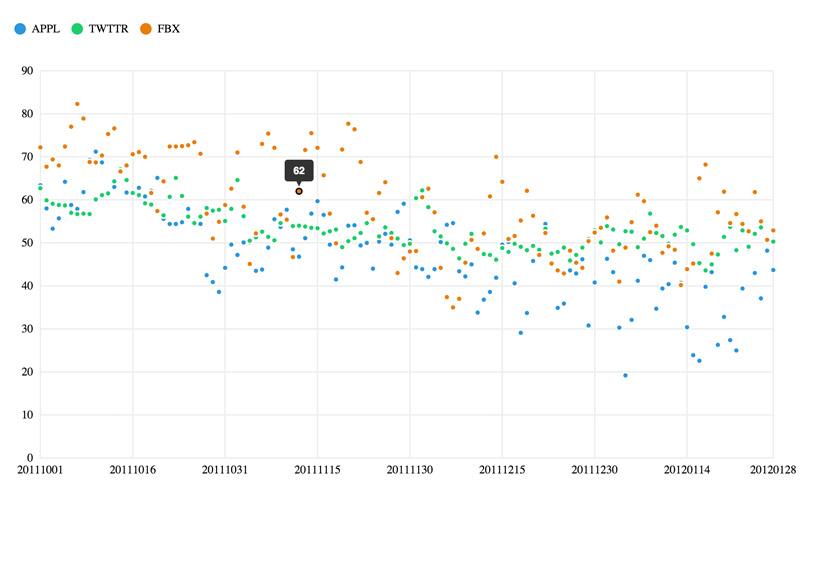
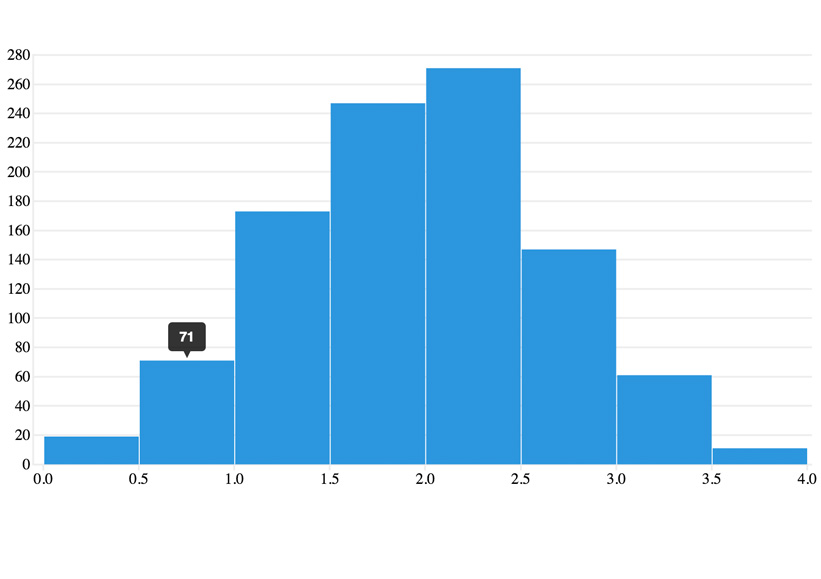
Histograms require that your data be in a single column, like so:
cat docs/example-data/hist.tsv | head -n 10
Randoms
2.210726696229596
2.5810759339537053
2.2380417870117735
1.5729785156579128
2.0729916188477784
0.9234921712955737
2.6866809729336065
2.4665987398546467
2.9494573633563905
Then we can get a histogram easily with:
suave docs/example-data/hist.tsv --chart histogram
Suave Viz supports input from stdin as well, so you can pipe data into it from anywhere.
mysql -h mysql-server.com -e "use prod_db; SELECT SUM(price) from product_sales GROUP BY day;" | suave --chart barcurl http://some-api/some-data | suave --chart histogram Suave Viz makes some assumptions about the data you pass it:
- The data is in TSV format (tab separated columns)
- The first line in the file is a header with names for each column (you can toggle this assumption)
- The first column in the file are your x-axis labels. These can be any text string
- Each column past the first is a series (ex separate line) of y-values you'd like to graph, they must be a number
- Histograms expect data with only a single column, every other chart type expects at least 2 columns (x and y)
suave [input file] --option1 --option2 valueNote if you do not provide an input file, Suave Viz will expect you to provide input through stdin, ex through a pipe:
cat some-file.tsv | suave --option1 --option2 valueSets the chart type to graph. With the exception of histogram, which expects a single input column, all chart types expect at least 2 columns (x and y values). The available chart types are: line, bar, scatter and histogram. The default chart type is line.
Use this to specify your column separator, ex "\t" for TSV "," for CSV etc. This defaults to TSV data, i.e. \t
By default, Suave Viz assumes your input has a header line but if your data does not include a header line (first line is the names of each column), set this flag.
Set's the chart's x-axis to the specified type. This will default to time if your data is formatted as a date (see below) and ordinal for everything else.
For time to be auto selected your dates must be in one of the following formats:
dd-MMM-yyyyyy-MM-ddyyyy/MM/ddMM-dd-yyyyMM/dd/yyyy
If log is selected the axis will use a base 10 scale. Since log is not defined at 0, your x-column (1st column in your data) cannot contain 0's.
Set's the chart's y-axis to the specified type. Defaults to linear.
If log is selected the axis will use a base 10 scale. Since log() is not defined at 0, your y-column(s) (any column in your data after the 1st) cannot contain 0's.
Sets how many "ticks" to draw on the x-axis. Defaults to 10.
If --chart line is selected, this option draws a circle that shows a tooltip on hover for each point in the chart. Defaults to not enabled.
If --chart line is selected, this smooths the chart lines. Defaults to not enabled.
If --chart line or --chart scatter is selected, this controls how big the circles for points are. Defaults to 6.
Rotates the bar chart 90deg so the bars extend horizontally instead of vertically. This is useful if you have many bars in your chart. Defaults to a vertical layout.
Sets how many evenly spaced buckets to use in the histogram. Defaults to 10 evenly spaced bins.
Sets the range of the buckets to use, ex --domain -10, 10 would render a histogram with buckets ranging from -10 to 10. By default Suave Viz will try to guess the domain based on your input data, this option allows finer grained control if you'd like to "zoom in" or "zoom out" on your histogram.
Suave Viz is available under two licenses depending on the use case: For non-commerical purposes Suave Viz is available under the Creative Commons Attribution-NonCommercial 4.0 license.
For commercial use cases send us an email with your use case to suavecharts@gmail.com to get more information.