See also Prometheus Kubernetes complete example
This repo deploys complete ELK stack (actually EFK: Elasticsearch, Fluentd, Kibana. But ELK abbreviation is more popular) with the following components:
- Elasticsearch
- es-data
- es-master (3 replicas)
es-data-master(see Upgrade from es-data-master deployment to splitted es-master and es-data)- es-client (client nodes which allow to communicate with the elasticsearch cluster, we use 2 pod replicas)
- fluentd - we use daemonsets, so fluentd is being scheduled on all worker nodes.
- kibana - one instance is enough. But you can easily scale it to two or more instances.
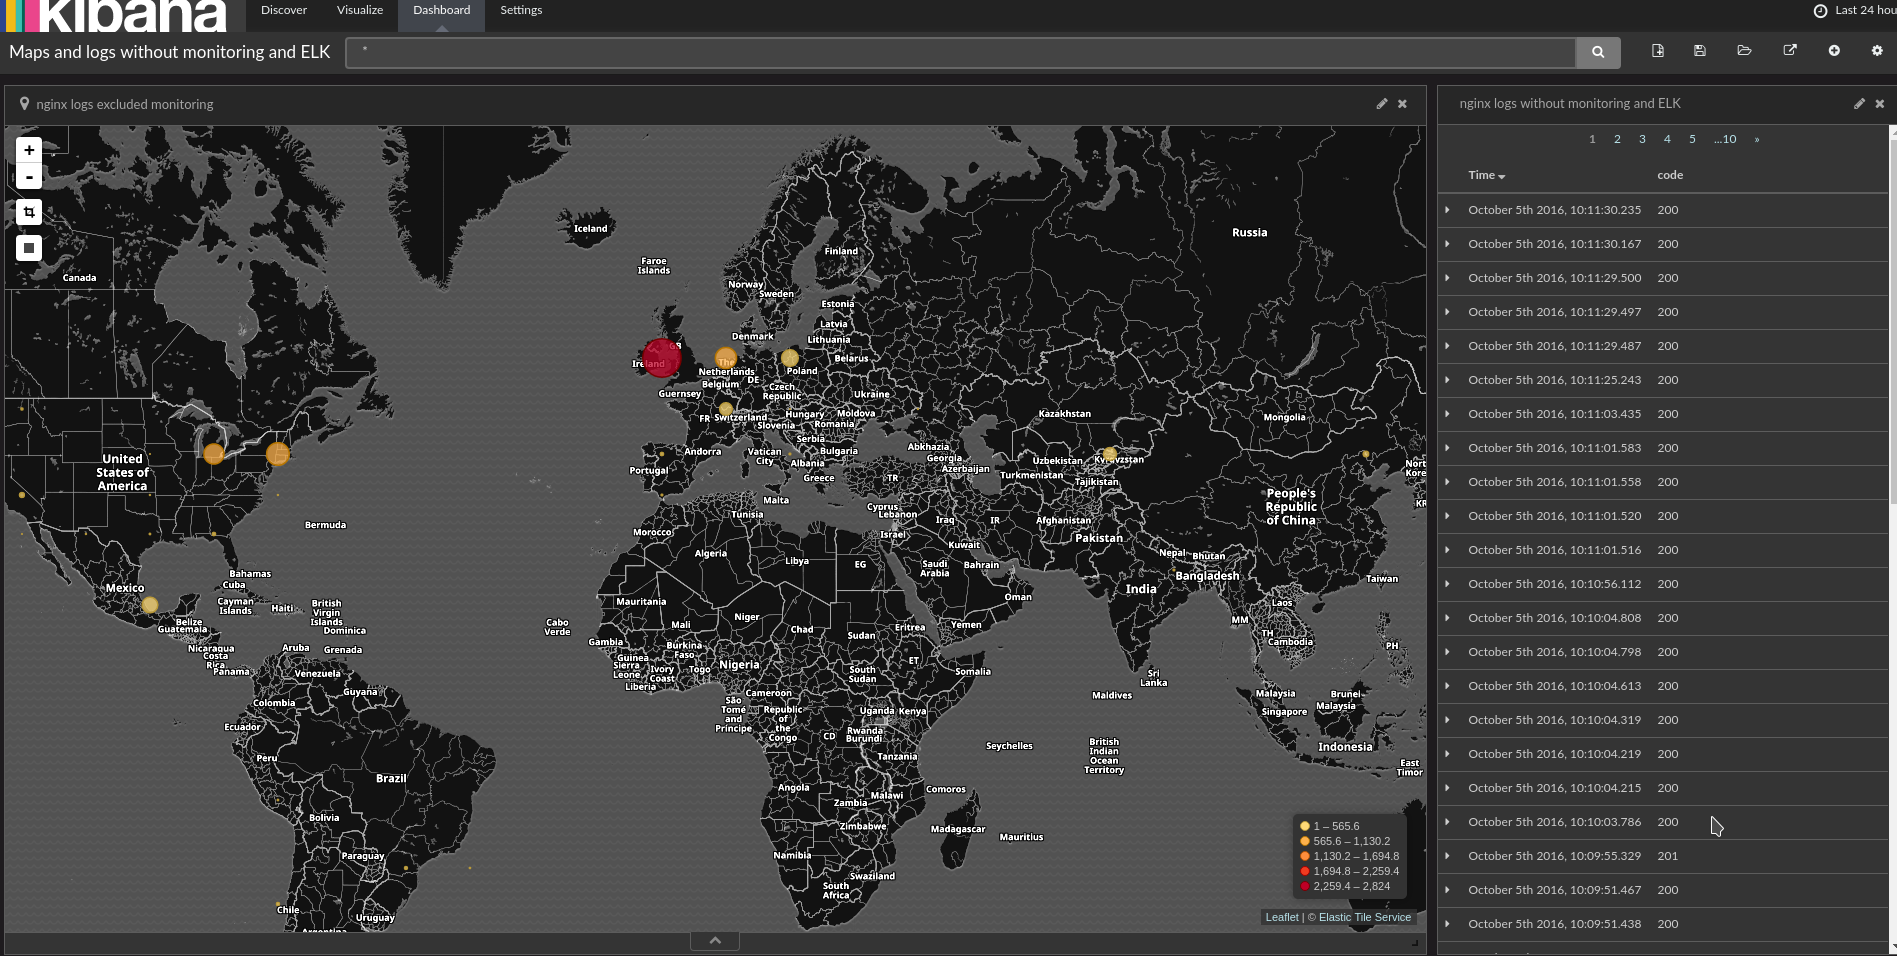
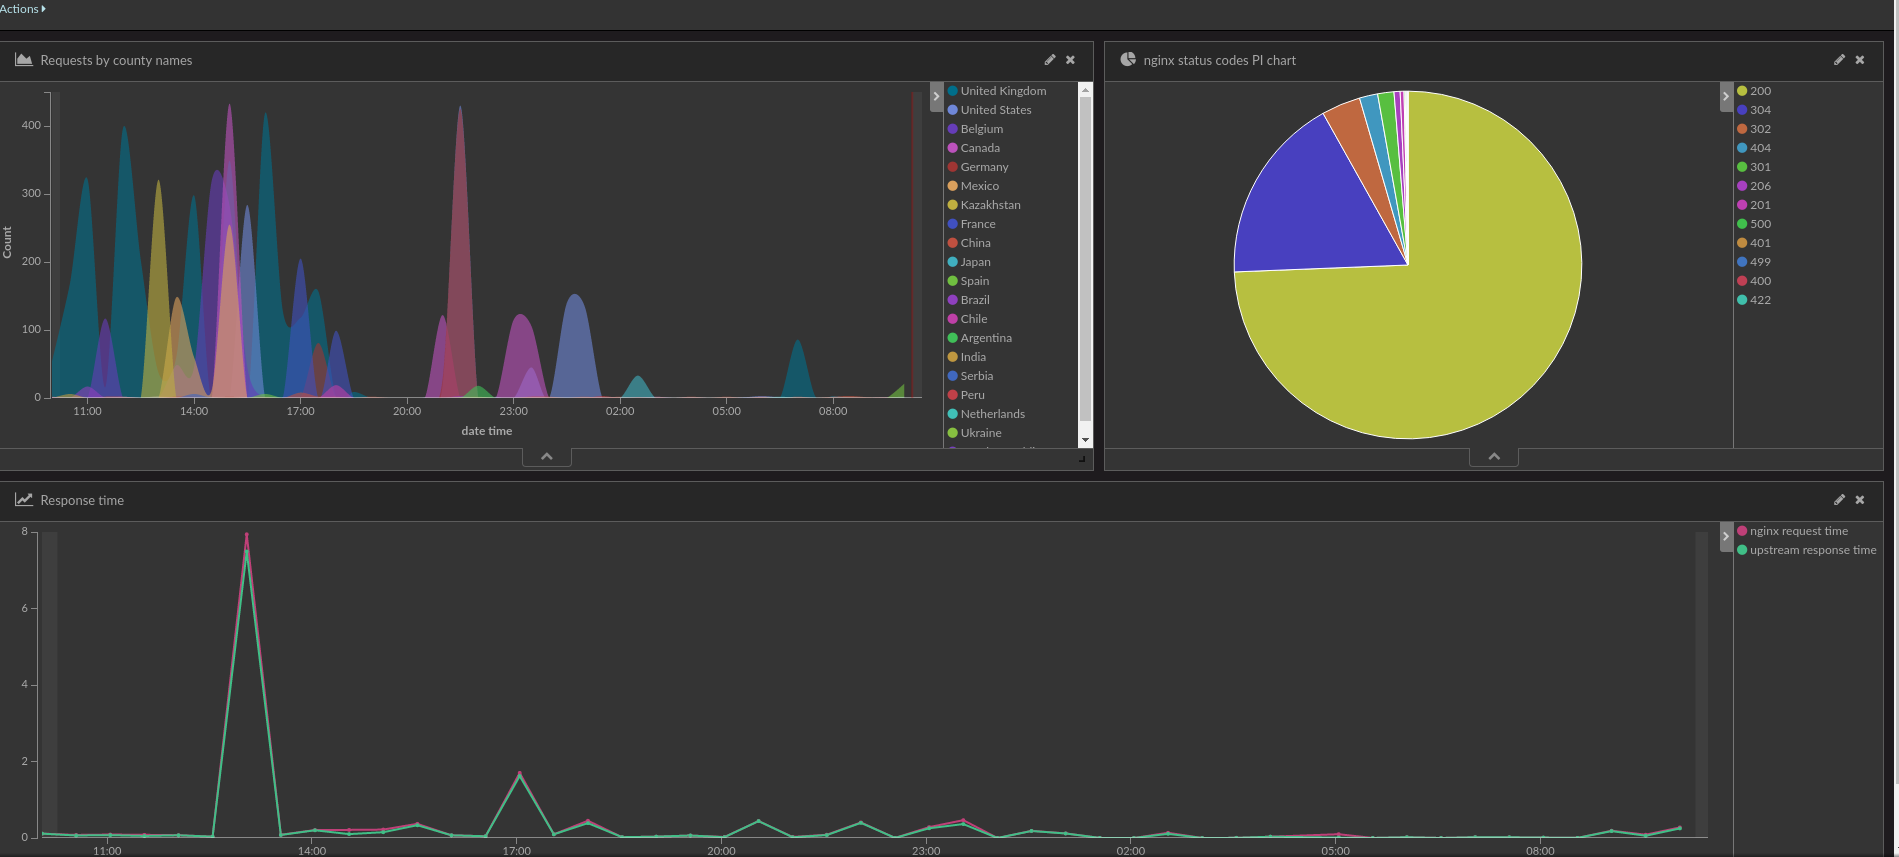
This repo already contains fluentd configuration example which works in most cases. It contains log modification examples, Java backtrace multiline logs processing, log parsing examples, Kubernetes events processing and more.
Kibana deployment has built-in Sentinl plugin (it works only with Kibana 2.4.x) which allows to generate notifications on logs anomalies. See watcher example (should be stored at https://kibana.example.com/app/sentinl).
This example uses monitoring namespace for Elasticsearch 2.x and 5.x. If you wish to use your own namespace, just export NAMESPACE=mynamespace environment variable.
This repo should not be used in production when you use insecure public network. Fluentd is configured to send logs to Elasticsearch using insecure connection.
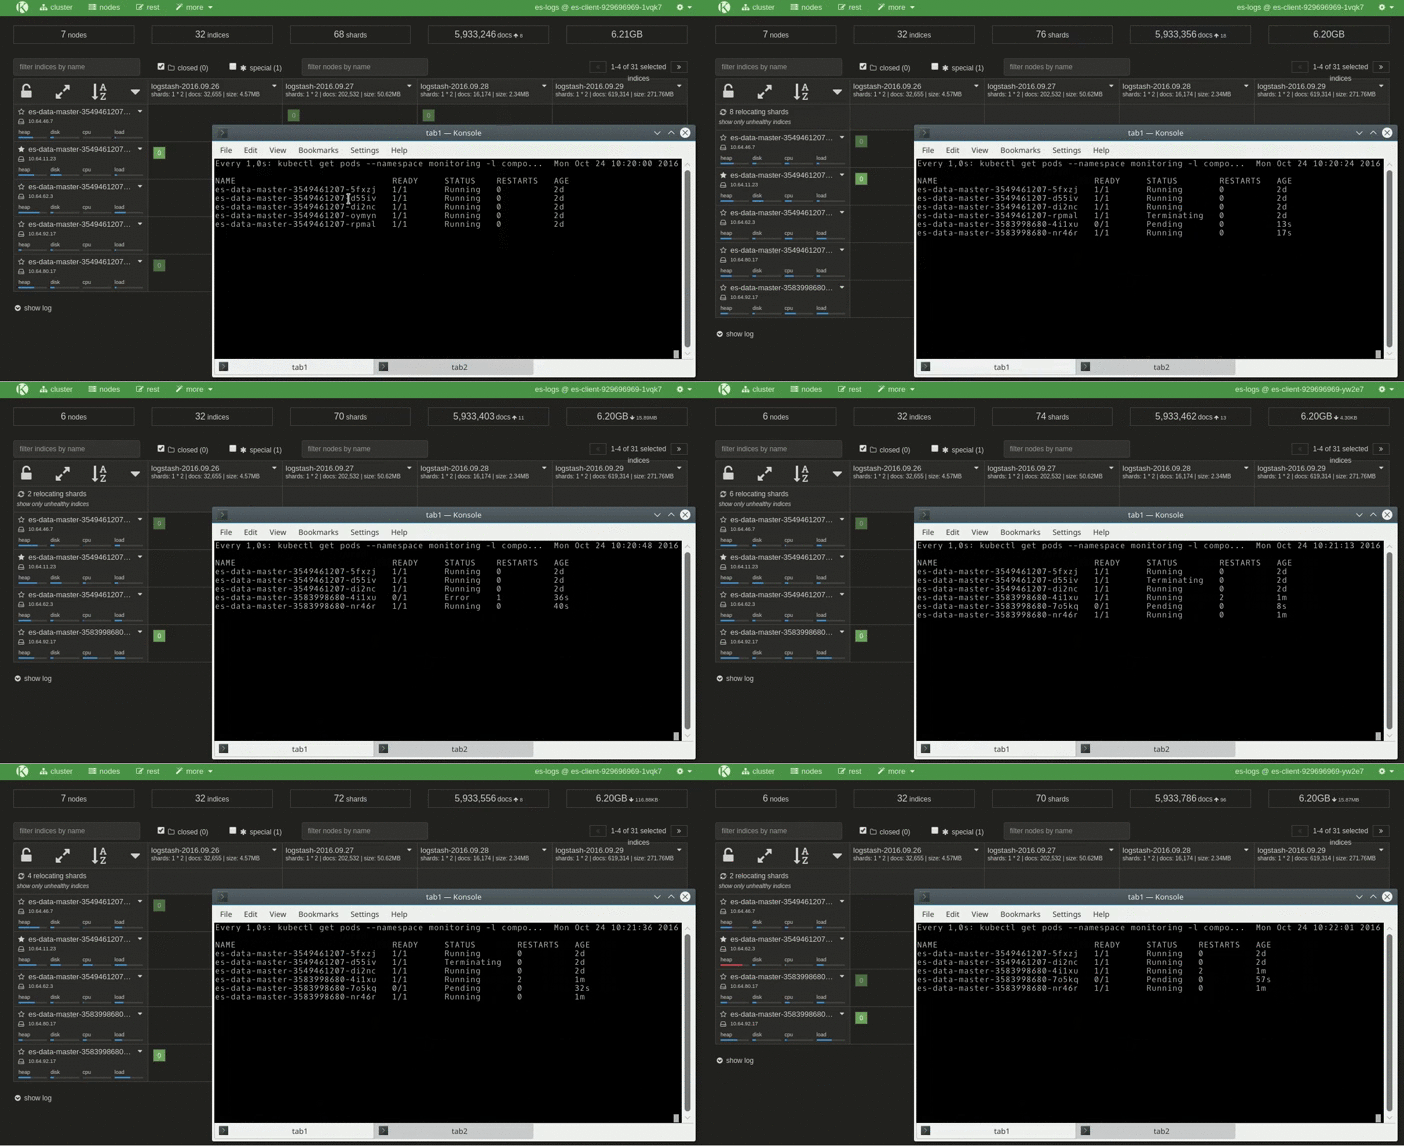
This repo contains Elasticsearch manifests which use stateless disk storage (emptyDir). It could be also useful for ephemeral storage in AWS. Fortunately using Elasticsearch Replica Shards we have data redundancy. An amount of replica shards could be defined in es-env.yaml configmap (only in Elasticsearch 2.x, for Elasticsearch 5.x please follow this doc), default value is 1 which allows to survive one Elasticsearch data pod failure. When one Elasticsearch data pod is down (or removed), Kubernetes Deployment will schedule a new one.
One replica shard requires at least three Elasticsearch data pods. Rolling upgrade will relocate all the data from the pod prepared to be terminated. If you have only two data pods, there will be no place to move replica shards.
Kubernetes supports Daemonsets but they don't provide rolling update feature. Thus this repo contains Deployment manifests with a hack - dummy 28651 hostPort which doesn't allow to schedule more than one pod on one node.
Kubernetes 1.4 introduced Inter-pod affinity and anti-affinity which also could be used to resolve this issue. es-data.yaml.tmpl already contains podAntiAffinity annotation, thus in case when you use Kubernetes 1.4.x, please comment out the 28651 hostPort related code.
Unfortunately Deployment's rolling update feature has a flaw, it doesn't limit pods in "Terminating" state even when you use preStop hook. To workaround this issue, ./deploy.sh script marks Kubernetes cluster nodes with the elasticsearch.data=true label. Which means that even when you have 10 nodes and 8 Elasticsearch pods, there will be not less than 7 Running pods and not more than one Terminating pod.
Unless Kubernetes implement its own templating support, users have to use what they have (or use Helm which should be installed). In most cases POSIX shell could be used and you don't have to install additional dependencies that is why deploy.sh uses render_template function as a hack that imposes appropriate restrictions: if you wish to use double quotes inside the shell template you have to escape them:
\"sample value inside double quotes\"It is recommended to use splitted master and node roles, otherwise insufficient HEAP on high load could damage your Elasticsearch cluster (node which was elected by master could not track data nodes and cluster could have red status).
If you already have data-master deployment from previous versions, you have to do the following:
- Delete old deployment and replicaset, but keep pods:
kubectl --namespace monitoring delete deployment es-data-master --cascade=false,kubectl --namespace monitoring delete rs es-data-master-INDEX --cascade=false - Change labels of the old pods from
role: datatorole: data-master - Deploy
es-master.yaml - Wait for masters appear in ES cluster
- Deploy
es-data.yaml - Remove old
es-data-master-*pods one by one and make sure indices were moved to newes-datapods
run.sh script inside Elasticsearch image contains shutdown handler which waits until the node move out all its data to another cluster nodes. And only when there is no data - pod shuts down. es-data.yaml.tmpl template contains a terminationGracePeriodSeconds: 31557600 option which prevents premature pod kill.
This repo already contains Curator deployment which by default removes indices older than 60 days (this option is configurable through es-remove-indices-older-than-days inside es-env.yaml file). Curator deployment uses crond which is already built in Apline Linux image and it runs curator_cli script every day at 2AM.
If you wish to update es-remove-indices-older-than-days variable, just edit es-env.yaml file and run update_curator.sh script.
Example of an ingress controller to get an access from outside:
apiVersion: extensions/v1beta1
kind: Ingress
metadata:
  annotations:
    ingress.kubernetes.io/auth-realm: Authentication Required
    ingress.kubernetes.io/auth-secret: internal-services-auth
    ingress.kubernetes.io/auth-type: basic
    kubernetes.io/ingress.allow-http: "false"
  name: ingress-monitoring
  namespace: monitoring
spec:
  tls:
  - hosts:
    - kibana.example.com
    - elasticsearch.example.com
    secretName: example-tls
  rules:
  - host: kibana.example.com
    http:
      paths:
      - backend:
          serviceName: kibana-logging
          servicePort: 5601
        path: /
  - host: elasticsearch.example.com
    http:
      paths:
      - backend:
          serviceName: elasticsearch-logging
          servicePort: 9200
        path: /
If you still don't have an Ingress controller installed, you can use manifests from the test_ingress directory for test purposes.
Simply run the command below:
./deploy.shIn case when you use extra kubectl context (cluster) configuration, simply set KUBECTL_PARAMS environment variable:
KUBECTL_PARAMS="--context=foo" ./deploy.sh
# or
export KUBECTL_PARAMS="--context=foo"
./deploy.sh
Deploy and watch for the status:
./deploy.sh --watch./undeploy.shIn case when you use extra kubectl context (cluster) configuration, simply set KUBECTL_PARAMS environment variable:
KUBECTL_PARAMS="--context=foo" ./undeploy.sh
# or
export KUBECTL_PARAMS="--context=foo"
./undeploy.sh./apply_labels_on_nodes.shThe command below applies es-env.yaml config and es-client.yaml deployment:
./update_es_clients.sh --watchThe command below applies es-env.yaml config and es-data.yaml.tmpl deployment:
./update_es_data.sh --watchThe kopf plugin is used for Elasticsearch 2.4 monitoring. You can view the cluster state using links below:
The cerebro is used for Elasticsearch 5.x monitoring. You can view the cluster state using links below:
Fluentd container is already configured to import indices templates. If templates were not improted, you can import them manually:
wget https://github.com/logstash-plugins/logstash-output-elasticsearch/raw/master/lib/logstash/outputs/elasticsearch/elasticsearch-template-es2x.json
curl -XPUT 'https://elasticsearch.example.com/_template/logstash-*?pretty' -d@docker/fluentd/elasticsearch-template-es2x.json
Please note that if the index was already created (i.e. brand new deploy), you have to remove old index with incorrect data:
# This index has incorrect data
curl -s -XGET https://elasticsearch.example.com/logstash-2016.09.28/_mapping | python -mjson.tool | grep -A10 geoip
    "geoip": {
	"properties": {
	    "location": {
		"type": "double"
	    }
	}
    }
# Here how to delete incorrect index (ALL THIS INDEX DATA WILL BE REMOVED)
curl -XDELETE https://elasticsearch.example.com/logstash-2016.09.28
or wait until new index will be created (in our setup new index is being created every day).
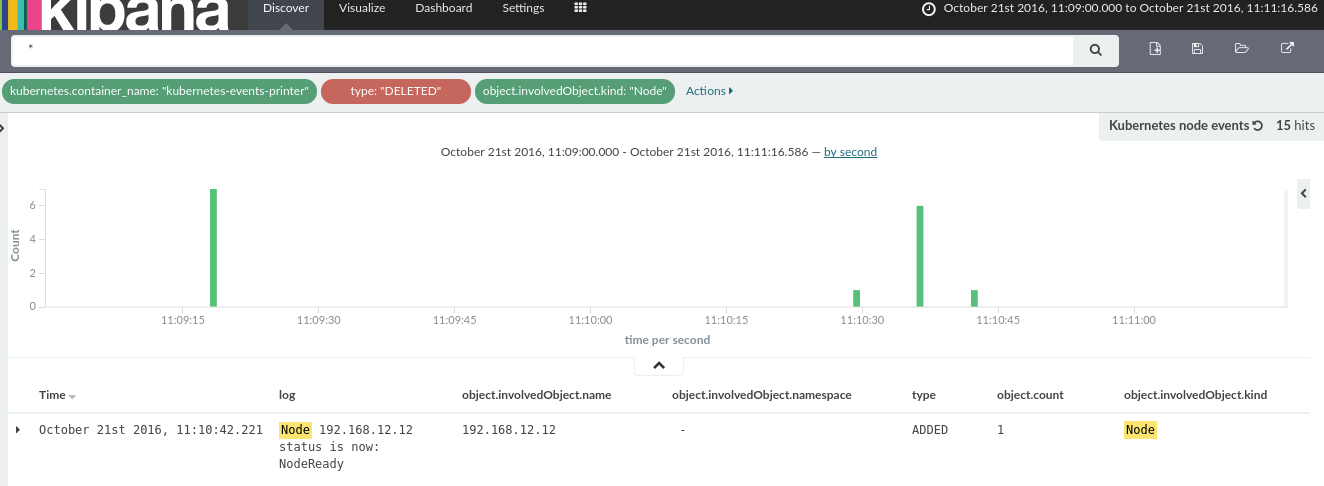
k8s-events-printer.yaml manifest is a simple alpine container with curl and jq tools installed. It prints all Kubernetes events into stdout and fluentd just parses and forwards these events into Elasticsearch as a regular json log.
journaldlogs don't show up in Kibana, probably because of the TZ issuesDELETEDKubernetes events could not be stripped for now, you have to create an exclude rule fortype:"DELETED", otherwise these events confuse Kibana users.- Kubernetes < v1.3.6 has a bug which stops pause container before graceful Elasticsearch pod shutdown which results in inaccessible data pod while moving out shards.
- In some cases after rolling update each new pod gets the same IP addresse as an old one. This results in one empty node after rolling update is done. New
docker/elasticsearch/pre-stop-hook.shalready contains a fix, but you have to manually clear thecluster.routing.allocation.exclude._hostoption:curl -XPUT http://elk:9200/_cluster/settings -d'{ "transient" :{ "cluster.routing.allocation.exclude._host" : "" } }"'. No up-and-running site-local (private) addresses founderror could be resolved setting the pod'sNETWORK_HOSTenvironment variable to0.0.0.0.
Experimental!. Please perform this procedure in test environment first. Sentinl events watcher still doesn't support 5.x revision.
Upgrade procedure requires persistant storage, since all Elasticsearch components should be shut down. In this case you have to modify es-env configmap first and set es-persistent-storage option to true:
es-persistent-storage: "true"Then modify es-data deployment and add persistent storage path, i.e.:
      - name: storage
        hostPath:
          path: '/data/elk'
This will trigger regular rolling upgrade procedure and enable persistant storage for Elasticsearch 2.x.
Then remove es-data, es-client, es-master and kibana-logging-v2 deployments and run ./deploy.sh script inside the es5 directory. It should deploy new Elasticsearch 5.x which has to upgrade existing Elasticsearch 2.x indexes.
Obtain the free license and register it with the command below:
curl -XPUT -u "username:password" 'https://elasticsearch.example.com/_xpack/license?acknowledge=true&pretty' -d @es-x-pack-license.json
- Convert this repo into Helm format.
- This repo uses modified config files from https://github.com/pires/kubernetes-elasticsearch-cluster
pre-stop-hook.shfrom https://github.com/jetstack/elasticsearch-pet- Initial Curator container: https://github.com/DocX/docker-curator-cron


