AJAX graph with MooTools.
Features:
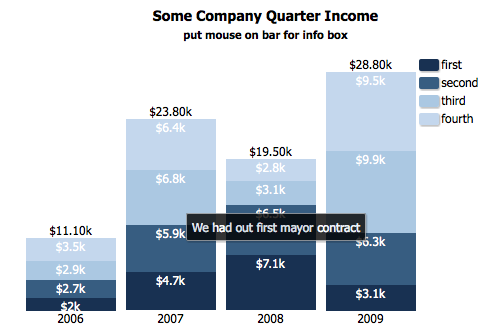
- You can set label, color, url and tooltip text for every bar
- Bars can be simple or stacked
- Legend can be created automaticaly
- Data can be loaded with AJAX and can have negative values for simple type
- Compatibile with all major browsers including IE
First you should create element in which you want to create graph. It can be something like:
<div id="myGraph"></div>
After that data array must be created. There are two types available: simple and stacked.
Array for simple type should be like this and everything except value is optional:
new graphData =  new Array(
	[value1,label1,color1,url1,tooltip1],
	[value2,label2,color2,url2,tooltip2],
	.....
	[valueN,labelN,colorN,urlN,tooltipN]
	);
For stacked type also only value is required and everything else is optional. It should look similar to next code:
new graphData =  new Array(
	[[value11,value12,...,value1M],label1,color1,url1,tooltip1],
	[[value21,value22,...,value2M],label2,color2,url2,tooltip2],
	.....
	[[valueN1,valueN2,...,valueNM],labelN,colorN,urlN,tooltipN]
	);
After you create container and data, you have to create mooBarGraph object with prepared arguments.
window.addEvent('domready', function() {
    var myGraph = new mooBarGraph({
    	container: $('myGraph'),
    	data: graphData
    });
})
This will be enought to create bar graph based on your data, but you can pass few additional options. List of options is in next section.
You should always have container and data options:
	container // element in which you want mooBarGraph to be created
	data // array of data for mooBarGraph
Other options are optional (list is shown with default values):
	width: 400 // width of graph panel in px
	height: 300 // height of graph panel in px
	title: false // graph title. can use html tags
	barSpace: 10 // space between bars in px
	color: '#111111' // default color for your bars
	colors: false // array of colors. it will be used for parts of stacked type or will be repeated for simple type
	sort: false // 'asc' or 'desc', this can be used only for simple type
	prefix: '' // string that will be show before bar value
	postfix: '' // string that will be shown after bar value
	legend: false // set to true if you want to lefend box be created
	legendWidth: 100 // width of legend box in px
	legends: false // array of values for legend
	showValues: true // for stacked bars type only. false to hide values in sub bars.
	showValuesColor: '#fff' // color for values in parts for stacked type
	realTime: false // refreshing graph with new data in real time
All you have to do is to call draw() function of your mooBarGraph object and pass url that will return data in JSON format.
myGraph.draw(url);
Example usage:
html
<a href="#" onclick="myGraph.draw('ajaxdata.php')>click here for new data</a>
ajaxdata.php
for($i=0;$i<10;$i++){
	$ajaxData[$i][] = rand(-5,5);
}

$ajaxData = json_encode($ajaxData);
echo $ajaxData;
The draw() function also can accept array as argument and create graph dynamicly.
myGraph.draw(arrayOfData);


- Version 1.3
- realTime option for data streaming
- fix for the bar difference issue, for positive values only ( thanks to Justin http://twitter.com/#!/barnt )