Annotation plotting utilities #1538
Comments
|
Thinking about labeled interval plots again, I remembered that we provide two functions for this in mir_eval: one allows for overlapping intervals and one expects disjoint intervals. Both of these are important and distinct use cases, and we should aim to support both. I'm not entirely sure that the approach I took in mir_eval's is the best at this point. Briefly:
The way to implement this, I think, is using blended transformations. This might raise some questions about how annotation plots might be changed or extended (eg when overlaying multiple annotations). |
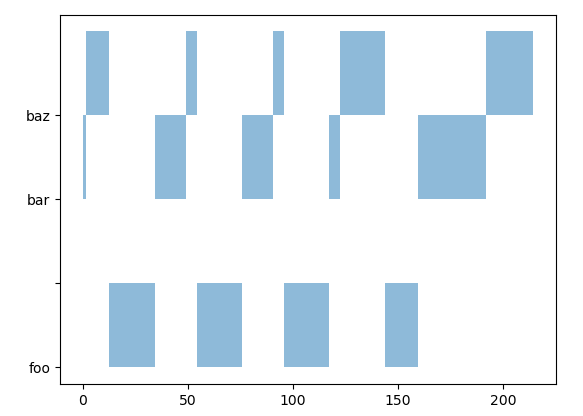
Dug into this a bit today. I was thinking that we could use categorical positions for the segment labels, as this is directly supported by many matplotlib primitives: https://matplotlib.org/stable/gallery/lines_bars_and_markers/categorical_variables.html It turns out that you can sort of do this with broken_barh. For example, this kind of works: ax.broken_barh(ivals[::3], ('foo', ''), alpha=0.5)
ax.broken_barh(ivals[1::3], ('bar', ''), alpha=0.5)
ax.broken_barh(ivals[2::3], ('baz', ''), alpha=0.5)Where foo, bar, baz are the labels, and the empty string is taking the place of the "height" of the bar collection. The result looks almost like what we want: ax.broken_barh(ivals[::3], ('foo', 'bar'), alpha=0.5)
ax.broken_barh(ivals[1::3], ('bar', 'bar'), alpha=0.5)
ax.broken_barh(ivals[2::3], ('baz', 'bar'), alpha=0.5)which works because under the hood, matplotlib is building a categorical mapping The problem with this is that we have no way to iteratively construct or overlay multiple interval plots. We could probably hack around that by doing some inverse axis transform hackery, but I don't like it much. |

|
Punting this upstream to the mpl discourse: https://discourse.matplotlib.org/t/advice-for-using-broken-bar-collections-with-categorical-axes/23171 |
|
Dropping this one from the milestone until the related matplotlib issue is resolved matplotlib/matplotlib#25133 |
Is your feature request related to a problem? Please describe.
The display module has traditionally focused on signals and spectrogram-like data, but I'm becoming increasingly convinced that we should also provide some features for visualizing annotations.
I've resisted this in the past because much of that functionality is provided well by mir_eval, and I'd prefer to avoid duplicating efforts. In many ways, mir_eval is the logical place for this sort of thing. However, there are also plenty of use cases outside of MIR and it's not reasonable to expect everyone to know about mir_eval for this purpose.
Some duplication of functionality might be okay and appropriate here, if it makes plotting generally more accessible.
Describe the solution you'd like
I don't think we need to fully replicate mir_eval's display module, but the following at least seem useful:
The others I think would be a little more out of scope (multipitch, hierarchical segments, etc). But the above would cover a pretty wide variety of use cases.
I'm not opposed to matching API and implementation here, but I think we might want to think about this from scratch first.
The text was updated successfully, but these errors were encountered: