SliceViewer: overlay a peaks workspace #6013
Assignees

Milestone
Comments
|
This issue was originally trac ticket 5167 |
|
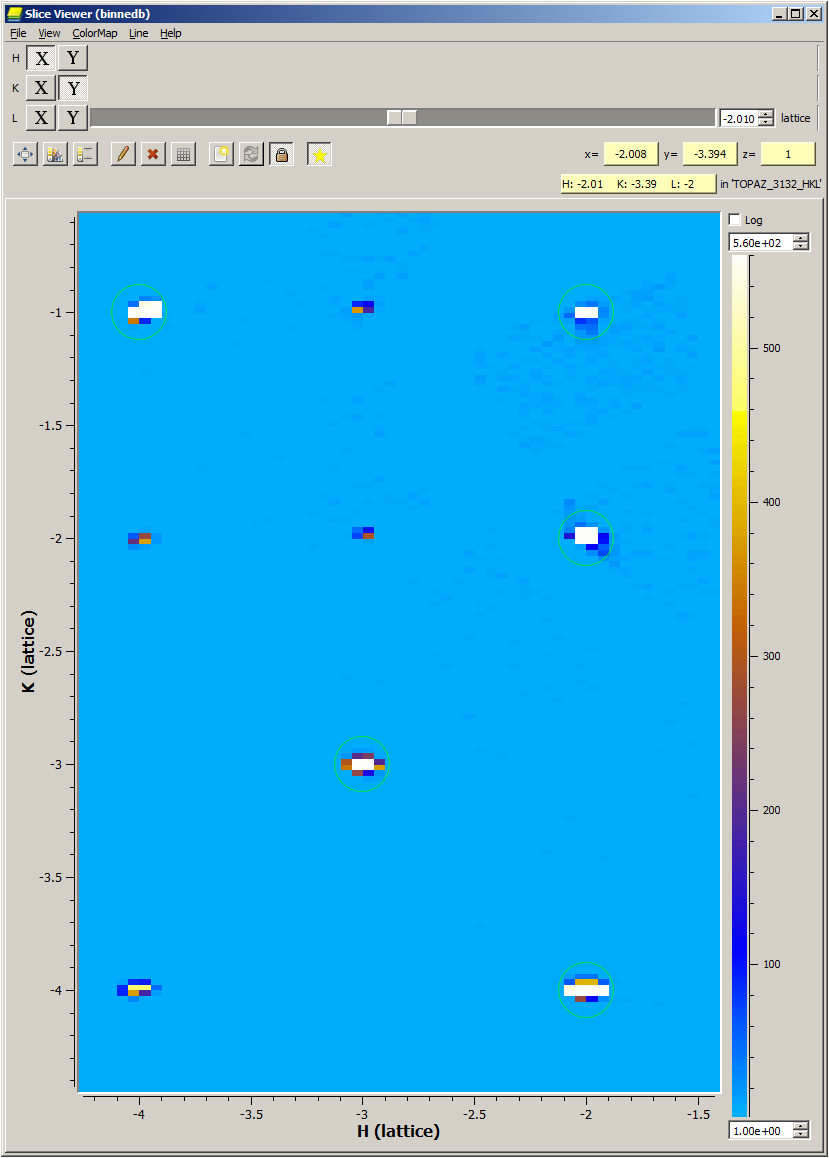
http://trac.mantidproject.org/mantid/raw-attachment/ticket/5167/PeakOverlays.png |
Sign up for free
to join this conversation on GitHub.
Already have an account?
Sign in to comment
Original Reporter: @jzikovsky
This ticket is blocks :
TRAC6247,TRAC6248,TRAC6249,TRAC6250Drag/drop (or something else) to add a PeaksWorkspace to a MDWorkspace being viewed.
Some code will have to choose the right dimensions to pick for the peaks, to match the MDWorkspace being viewed (HKL vs Qlab vs QSample)... Right now, I would use the names of the dimensions as a guide.
I think it would be nice to show peaks as circles that come in and out of view as you scroll around. The circles could have different opacity based on whether they are in front of or behind the screen. I'm not sure how to handle the drawing, on top of the QwtPlotSpectrogram. Presumably something like the LineOverlay, with a mostly-transparent widget covering the whole space?
I'm sure people will later want to add things like labels (HKL) and the ability to click on it to get more information.
The text was updated successfully, but these errors were encountered: