(this research was done between Alexander V. Mantzaris, Samuel R. Rein, Alexander D. Hopkins; based at the University of Central Florida), currently availabe at JASSS; http://jasss.soc.surrey.ac.uk/21/1/1.html (if you use the data for publication please cite this work for which it has been curated for)
- written in Julia
- the dataTables folder provides in CSV format the judges scores for each country during the competitions from 1957 till 2017 with row and column headers to understand easily 'for a country in a particular year, how did that country award the scores it had available'?
- The code provided computes statistically significant edges between countries for periods of years. We compute the edge set for periods of years (annual event) over time window producing a set of edges which allows use to see different networks of edges representing biases (1 way or 2 way)
- Did country X give country Y substantially more scores from 1995-2005? (1 way bias)
- How many times did country X give country Y substantial votes in 1975-2010 over periods of 5 years?
- Do Countries X and Y reciprocate the biased voting to 'collude' in sharing scores? (2 way bias)
- Can we see in a graph the set of edges between all countries that exhibited 1 way or 2 way bias?
- If we look at a period of X years, is the collusion present in both halfs of this period if we brea the years into 2 different segments?
Running the code for the hypothetical scenario, of looking at the period 1990-2010 where the significance is determined in every 5 years.
- include("Mantzaris.jl)
- include("demo.jl")
- demo(1990,2010, 5)
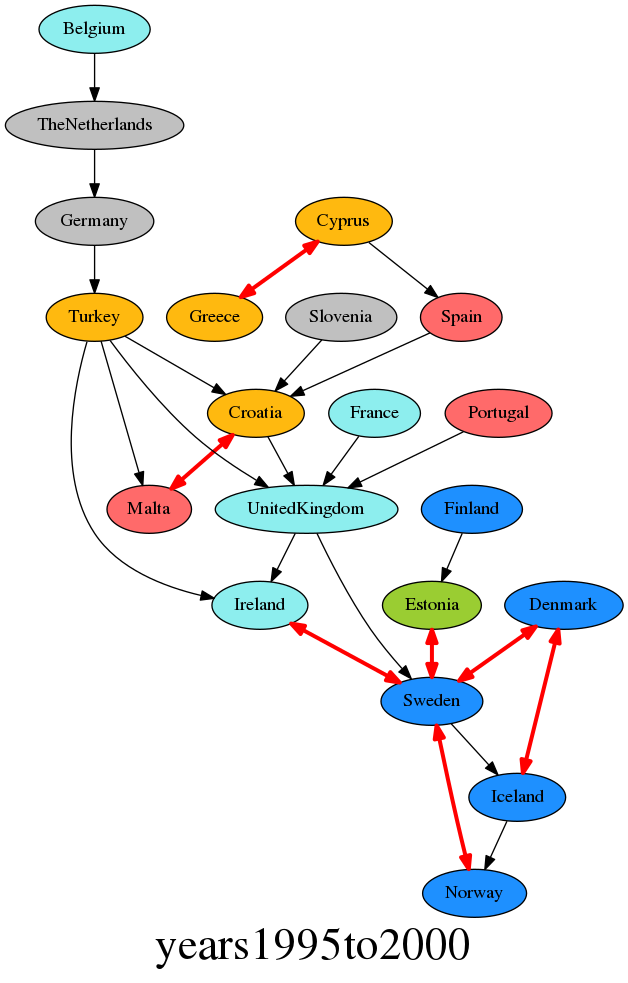
The output figures are all produced with intuitive names and captions in the local directory
We see in these two periods of 5 years how many times (max 2) collusion between countries existed.
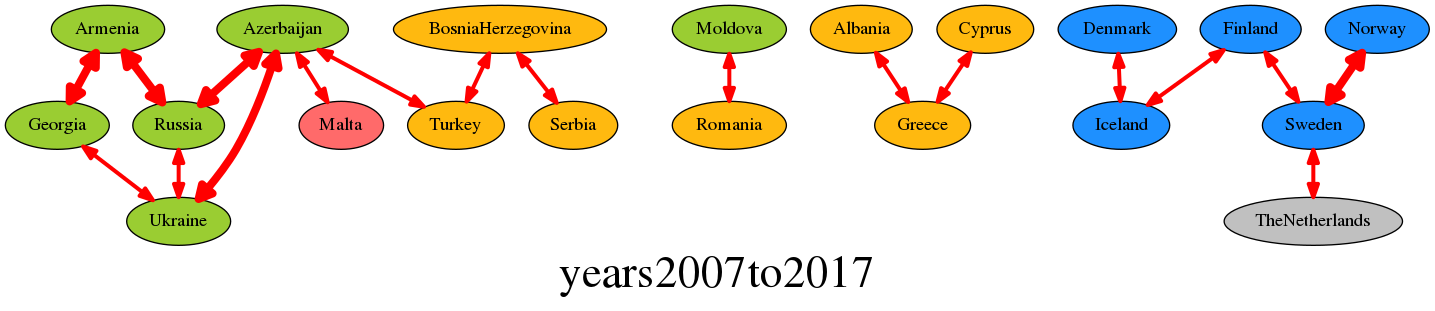
We look for the one way biased score allocations between countries in black arrows and the two way collusive edges in red.