Problem with subplot / matplotlib.dates interaction #1086
Comments
|
You are missing something, but it is something that is quite non-intuitive and easy to miss: Locators can't be shared among axes. The set_major_locator() method assigns its axis to that Locator, overwriting any axis that was previously assigned. |
|
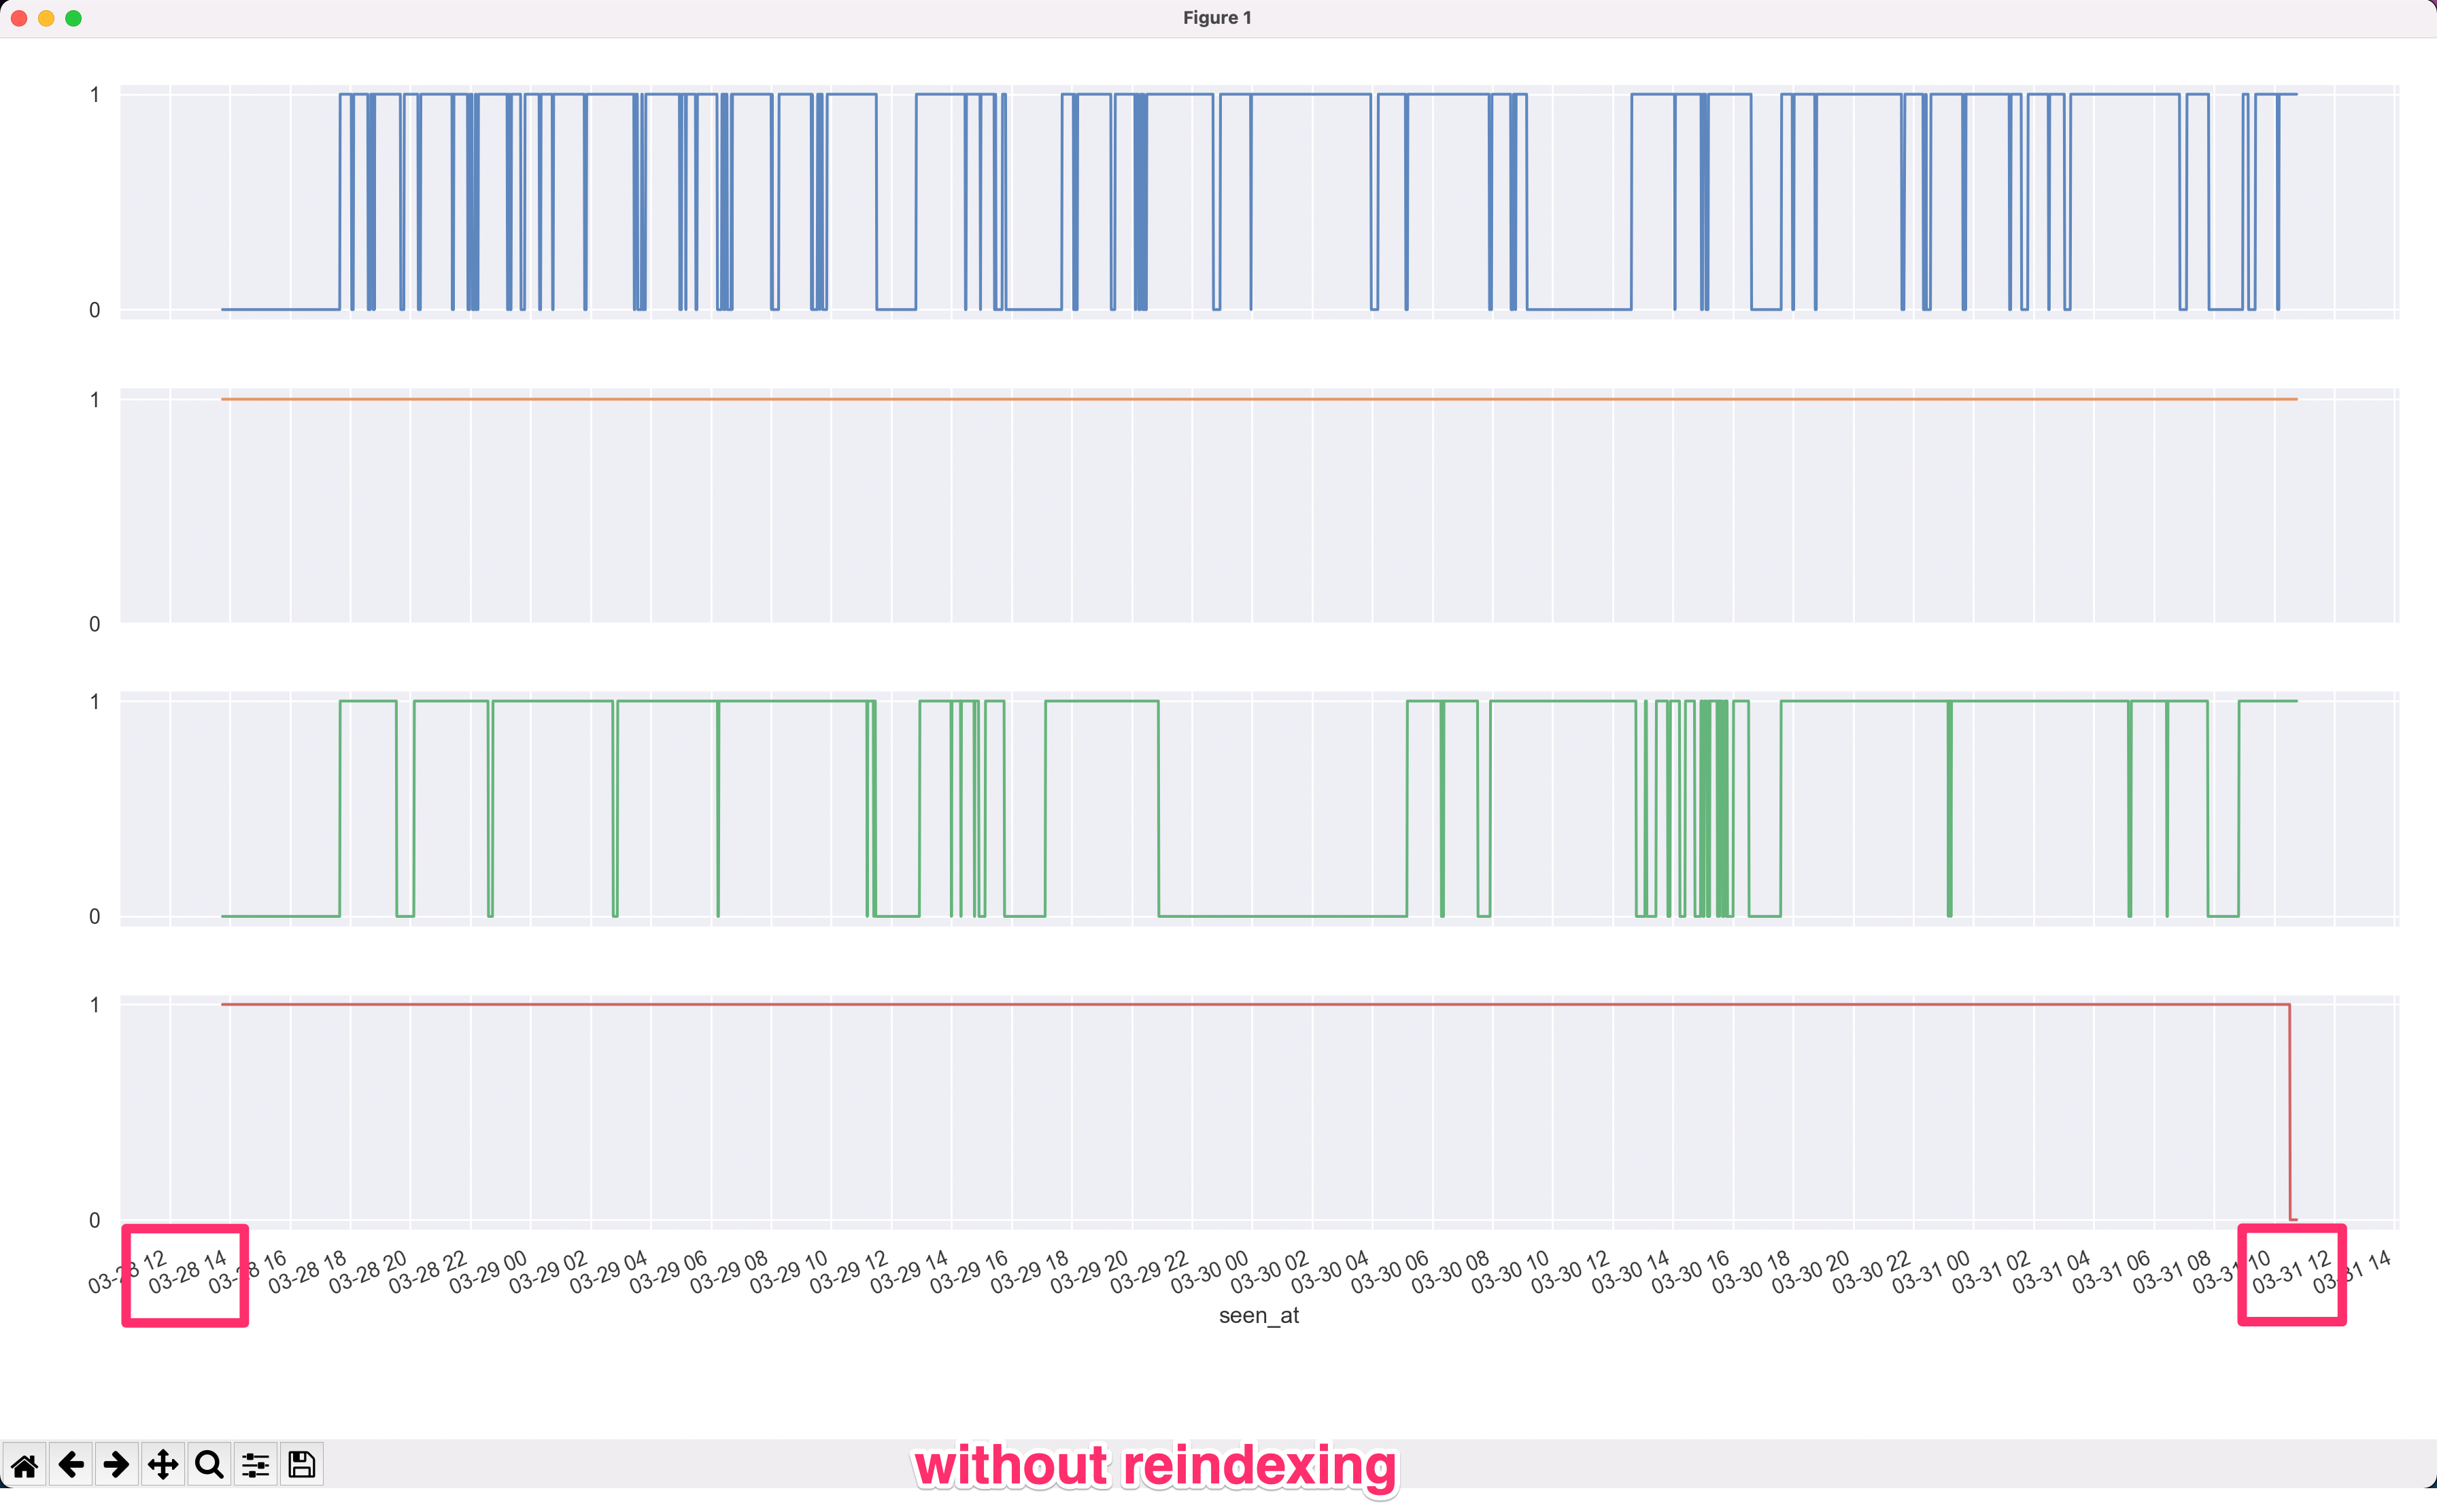
@efiring Hi, would you be so kind to explain to me why reindexing a dataframe breaks Without: With: Code: now = datetime.utcnow()
min_freq_idx = pd.date_range(min(df.index), now, freq="min")
df = df.reindex(min_freq_idx, fill_value=0)
axs = df.plot(subplots=True, yticks=[0, 1], rot=23, grid=True, figsize=(12,6), legend=False)
for ax in axs:
ax.xaxis.set_major_locator(mdates.HourLocator(interval=2))
ax.xaxis.set_major_formatter(formatter = mdates.DateFormatter("%m-%d %H"))Thanks! |

|
@seguri Please open an issues on Pandas. They maintain a set of locators that are index aware. |
|
@tacaswell I will. Could I get rid of Pandas in the meantime and migrate this maybe to pure numpy data, so that I can plot it correctly? EDIT Something like this rows, cols = len(df.columns), 1
fig, axs = plt.subplots(rows, cols, figsize=(12, 6), tight_layout=True, sharex=True, clear=True)
for i, ax in enumerate(axs):
ax.xaxis.set_major_locator(mdates.HourLocator(interval=2))
ax.xaxis.set_major_formatter(mdates.DateFormatter("%m-%d %H"))
ax.tick_params(labelrotation=25)
ax.plot(df.index.to_numpy(), df.iloc[:, i].to_numpy()) |
|
That should work. |
I've been plotting timeseries data using the matplotlib.dates module and have come across an issue when using it in conjunction with the subplot command.
For figures with greater than one subplot in a particular column, the time (or x) axis ticks and their labels are only printed on the final subplot that is plotted, and are missing on all other subplots in that column (see example code below). The only exception is when the time axis is identical for each plot in the column (you can test this by editing my example code at ###) - then all time axis ticks and their labels are displayed correctly.
Is this a bug in the subplot source code, or am I missing something?
from pylab import *
from matplotlib.dates import YEARLY, DateFormatter, rrulewrapper, RRuleLocator, drange
import datetime
tick every 5th easter
rule = rrulewrapper(YEARLY, byeaster=1, interval=5)
loc = RRuleLocator(rule)
formatter = DateFormatter('%m/%d/%y')
data for subplot 1
date1 = datetime.date( 1952, 1, 1 )
date2 = datetime.date( 2004, 4, 12 )
delta = datetime.timedelta(days=100)
dates = drange(date1, date2, delta)
s = rand(len(dates)) # make up some random y values
plot subplot 1
ax1 = subplot(211)
plot_date(dates, s)
ax1.xaxis.set_major_locator(loc)
ax1.xaxis.set_major_formatter(formatter)
labels = ax1.get_xticklabels()
setp(labels, rotation=30, fontsize=10)
data for subplot 2
date1 = datetime.date( 2052, 1, 1 ) ###( 1952, 1, 1 )
date2 = datetime.date( 2104, 4, 12 ) ###( 2004, 4, 12 )
dates = drange(date1, date2, delta)
s = rand(len(dates)) # make up some random y values
plot subplot 2
ax2 = subplot(212)
plot_date(dates, s)
ax2.xaxis.set_major_locator(loc)
ax2.xaxis.set_major_formatter(formatter)
labels = ax2.get_xticklabels()
setp(labels, rotation=30, fontsize=10)
show()
The text was updated successfully, but these errors were encountered: