set_xticklabels changes font when text.usetex is enabled #1516
Comments
|
After reading through the code for |
Sign up for free
to join this conversation on GitHub.
Already have an account?
Sign in to comment
|
After reading through the code for |
If
text.usetexis enabled, then setting tick labels usingAxes.set_xticklabelscauses the font to be changed (as iftext.usetexwere disabled) for that axis.Example output is below.
Before calling
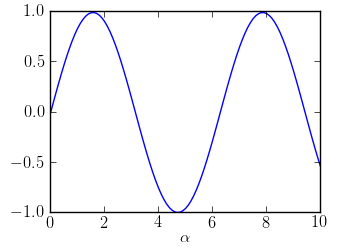
ax.set_xticklabels:After calling

ax.set_xticklabels:The text was updated successfully, but these errors were encountered: