Normality interpretation #77
Comments
|
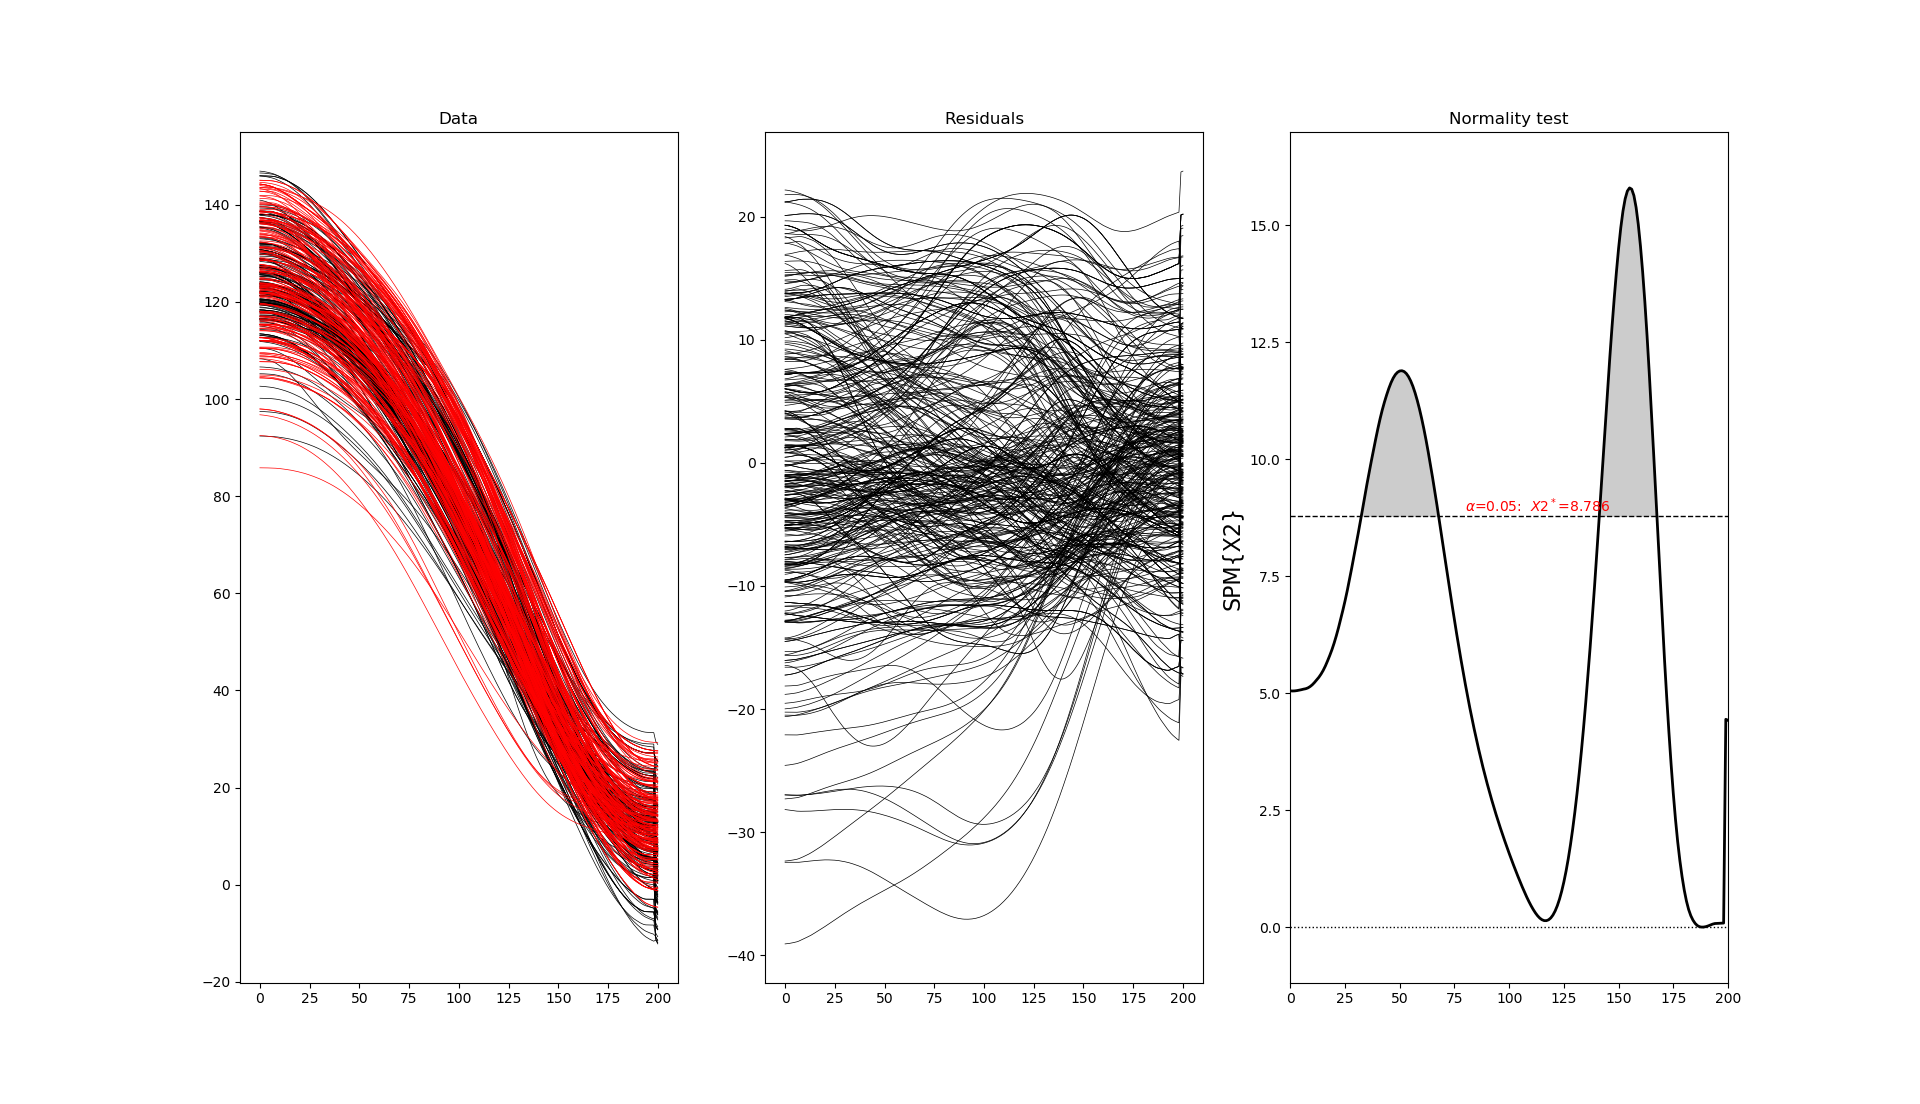
Hi Shahab, apologies for the delay. Since the X2 continuum crosses the critical threshold, the first interpretation is: truly normal data would produce a similarly high X2 continuum relatively infrequently. To further aid with interpretation I'd suggest also running the corresponding nonparametric test (spm1d.stats.nonparam.ttest2). If the results are not qualitatively different from the parametric results, it would suggest that the parametric approach's assumption of normality is a reasonable one, despite the existence of potential outliers and/or other non-normal characteristics. On the other hand, if the parametric and nonparametric results do not agree qualitatively, it would suggest that the assumption of normality may not be justified for this particular population, in which case the non-parametric results should be preferably reported. Regardless, it may be worth reporting both parametric and non-parametric results in reports as a type of sensitivity analysis, to demonstrate sensitivity, or lack of sensitivity to the parametric assumption of normality. Todd |
|
Thanks, Todd, Your information was very helpful. Shahab |
Hi Todd,
I have managed to perform the normality test for the two-sample t-test, but I have difficulty interpreting them because partially the curve exceeds the threshold. I know it may sound like a very stupid question, but I can surely use some help.
Regards,
Shahab
The text was updated successfully, but these errors were encountered: