P-values less than threshold values #156
Comments
|
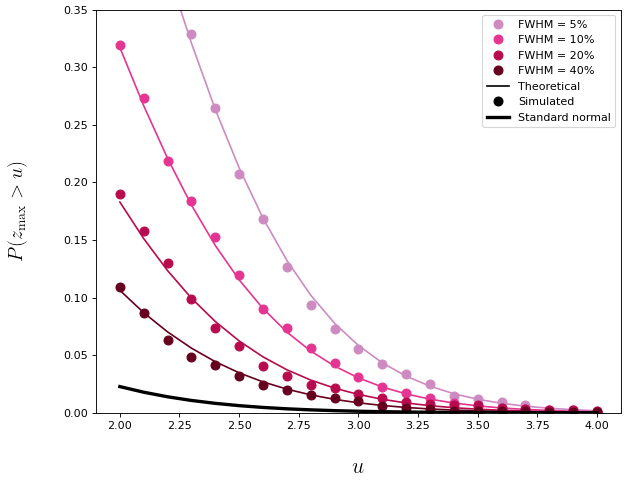
(I think this is referring to either the threshold directionality, or cluster-specific p values, but if I have misinterpreted please clarify.) Threshold directionality: Maximum cluster-level p-value: The probability associated with the test statistic maximum itself can be greater than alpha, but this probability is usually not reported in the SPM literature. Please consider the figure below, which is referenced from spm1d.org/rft1d/Theory. This shows the probability that the the test statistic maximum ( |
|
This is based on a non parametric t- test of a small sample continuous data set. The spm ensemble plot did look as though there were some differences but that was result of test. |

|
OK. Do you have a question about the results? |
|
Yes, in this case is this saying that at 90-100% of the movement there was not a significant difference since the p value was greater than 0.05? And what does that then say about describing the rest of the curve? I asked since as you mentioned earlier there is a lack of confidence with confirming certain assumptions when going the non-parametric route. In the instances so far when I've seen this the parametric test has not returned a curve which crosses any thresholds. So I'm seeking some clarity on how this scenario is reported when reporting. |
|
Something is very strange with these results, the p value shouldn't be bigger than alpha. Can you please re-run the code below, then copy-and-paste the output of the spm = spm1d.stats.ttest_paired(Y1, Y2);
spmi = spm.inference(0.05, 'two_tailed',true, 'interp',true);
disp( spmi ) |
|
I agree Todd. Results below: Parametric results: SPM{t} inference |
|
Two points:
|
|
Hi Todd. See below for the non-parametric test: ### Code I'm running: %(1) Conduct non-parametric test: Non-Parametric results:SnPM{t} inference (1D) |
|
Thank you very much for this output, this clarifies the problem. The problem is that there are only 16 unique iterations, so the minimum probability is To check this, try artificially doubling the dataset size: s1 = [s1; s1];
s2 = [s2; s2];
snpm = spm1d.stats.nonparam.ttest_paired(s1, s2);You should then see that the p-value falls below 0.05. Only artificially increase the sample size this way for debugging purposes; do not do this for reporting purposes. I will need to add a warning message to the software that warns users if the minimum p-value is greater than alpha. I'll work on this bug-fix and I'll update the software tomorrow. Thank you for reporting this problem! |
|
Hi Todd, Thanks for that. yes, I had actually already tried the doubling aspect when I got the error for normality being tied to 8 observations to just see the code response. I thought that the non-parametric took care of the potential lack of normal distribution and the potentially small sample since my understanding is that they utilize some measure of wilcoxon ranked test under the hood and normality using shapiro-wilk. My question then is given the small sample sizes, then are you saying that these tests cannot accurately provide a result that I can potentially report in literature on and I would need to use SPSS or some other tool? |
spm1d uses a nonparametric permutation technique. See Fig.4 and Appendix A in this article (free download available). This test is not a rank test, but performs quite well, especially for moderate-to-large sample sizes.
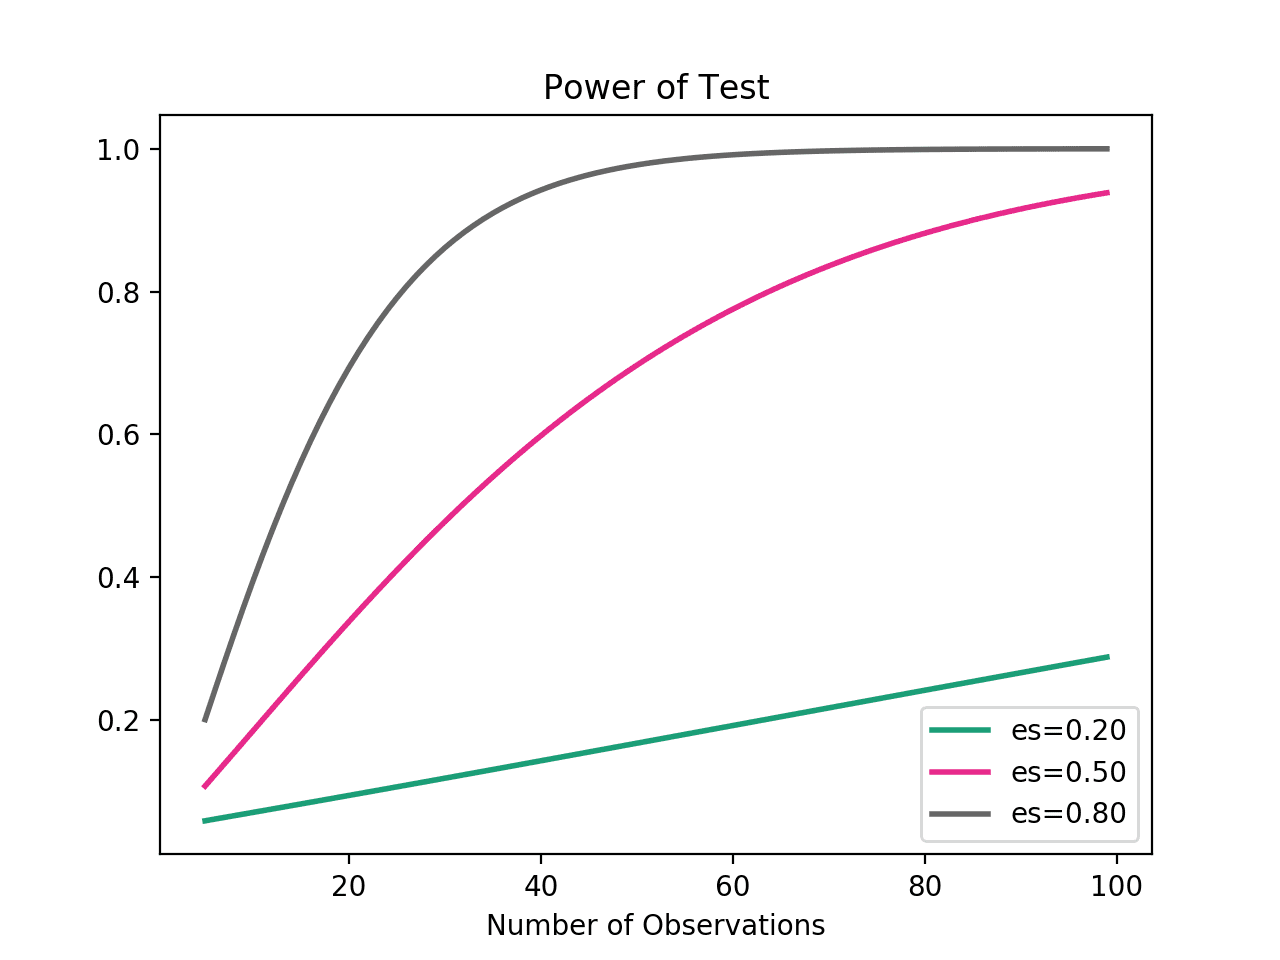
The tests are accurate, the problem is power. No technique (parametric or nonparametric, including those in SPSS) can give powerful, stable results for such small sample sizes. If you report results for a sample size of N=4 in a submitted paper, editors and/or reviewers will likely flag the result as problematic due to small sample size, especially if there is no clear a priori justification for that sample size. Considering the figure below (from this site), it is clear the a sample size of N=4 is insufficient for reaching the standard power level of 0.8, unless the hypothesized effect is extremely large. So my suggestion is: conduct a priori power analysis to determine the approximate sample size that you need. I suspect that the sample size would be in the range 8-to-12 for moderate effects and approximately 20 for smaller effects. |
|
Hi Todd Understood, thanks much for the additional resources. I have already gotten approval for my sample size, so I am just looking for the best test(s) that suit my needs in terms of reporting but will consider all the above accordingly. |
Redirected from #154
The text was updated successfully, but these errors were encountered: