Imagine you can turn simple Python scripts into beautiful web applications. Well, that tool exists, and it's called Streamlit.
Streamlit is an open-source framework for creating data science and Machine Learning applications for the fastest possible data exploration. It even gives you a real-time coding experience. You can start your Streamlit application, and every time you save, you will see your code reflected in the browser simultaneously!
- Adopts Python scripts. If you know how to write Python scripts, you can write Streamlit applications. For example, this is how you write to the screen:
import streamlit as st
st.write('Hello, world!')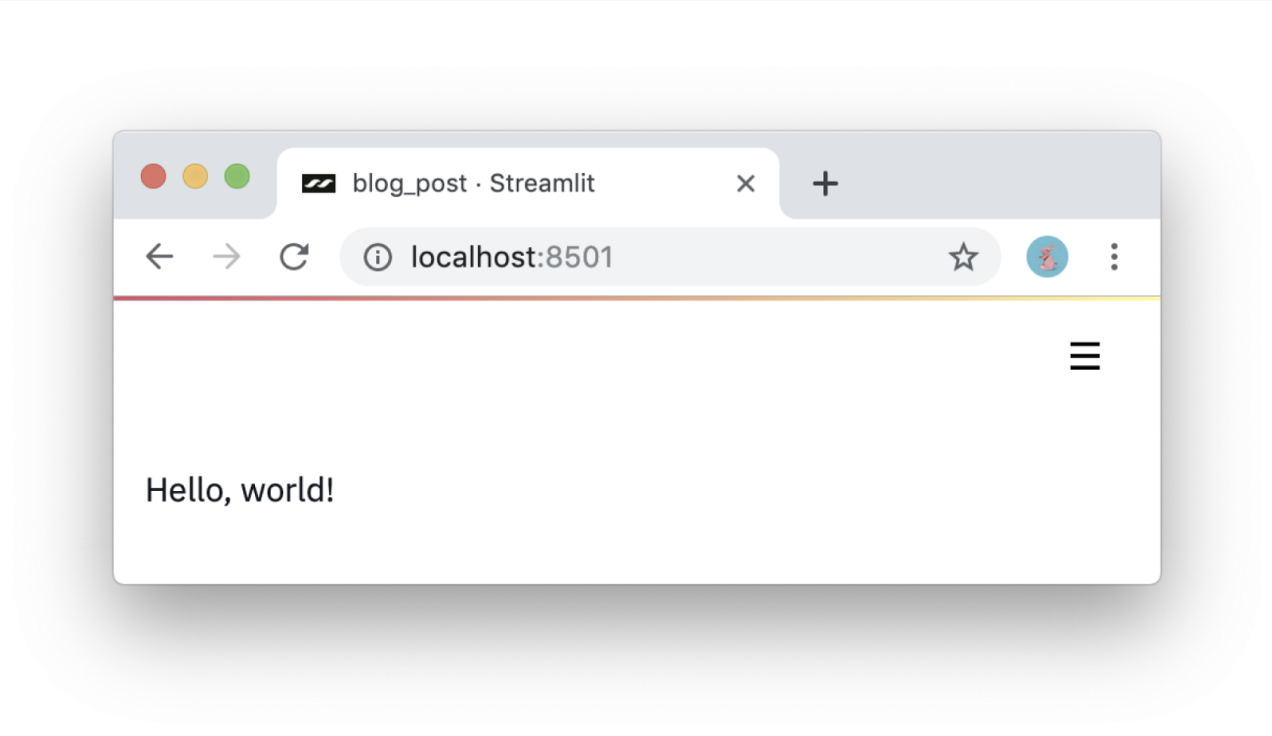
- Treat widgets as variables. There are no callbacks in Streamlit! Each interaction re-runs the script from top to bottom. This approach leads to really clean code:
import streamlit as st
x = st.slider('x')
st.write(x, 'squared is', x * x)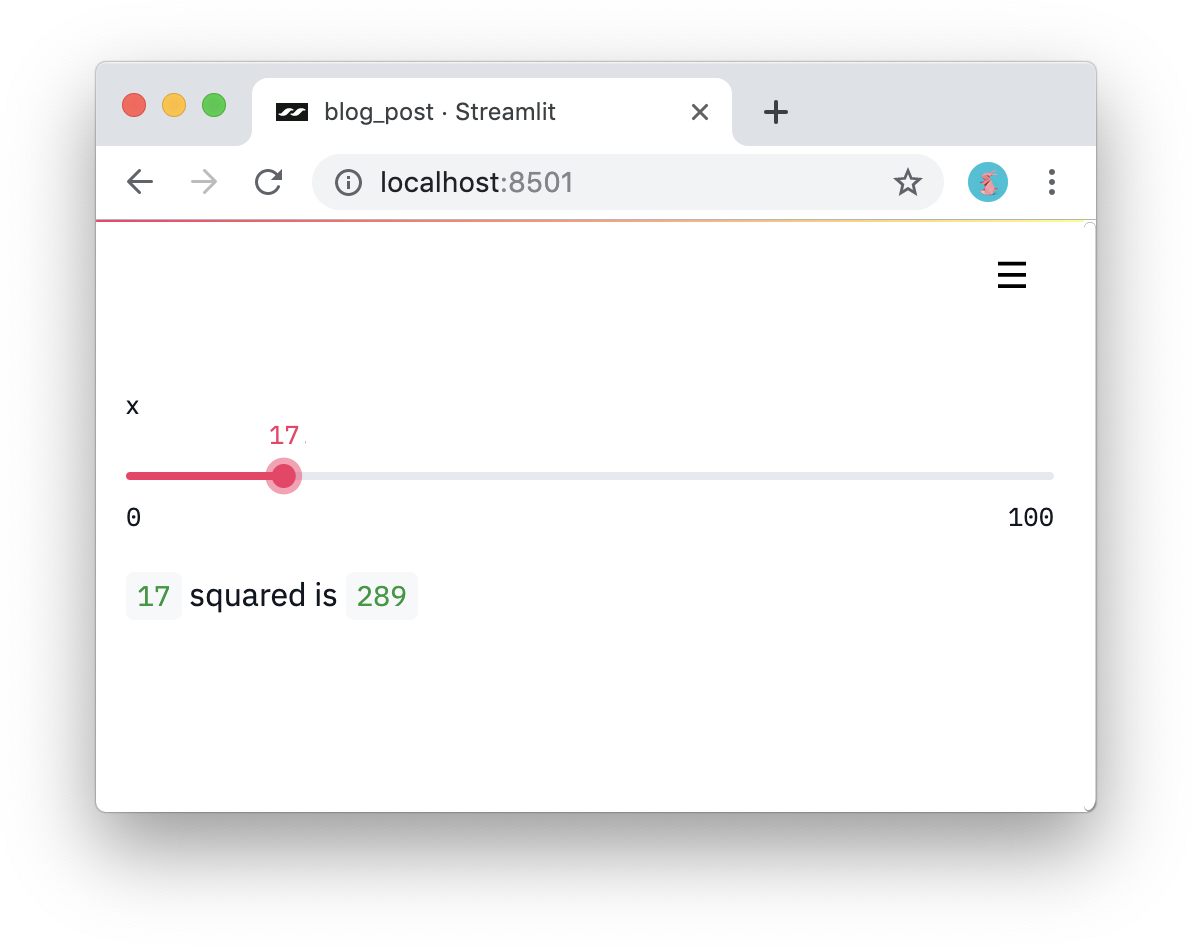
- Reuse data and computations. What happens if you download a lot of data or perform complex calculations? The key is to reuse information between runs safely. Streamlit introduces a caching primitive that acts as a default persistent and immutable data store, allowing Streamlit applications to reuse information safely and effortlessly. Look at the following example:
import streamlit as st
import pandas as pd

# Re-use the CSV in your code executions!
read_and_cache_csv = st.cache(pd.read_csv)

BUCKET = "https://streamlit-self-driving.s3-us-west-2.amazonaws.com/"
data = read_and_cache_csv(BUCKET + "labels.csv.gz", nrows=1000)
desired_label = st.selectbox('Filter to:', ['car', 'truck'])
st.write(data[data.label == desired_label])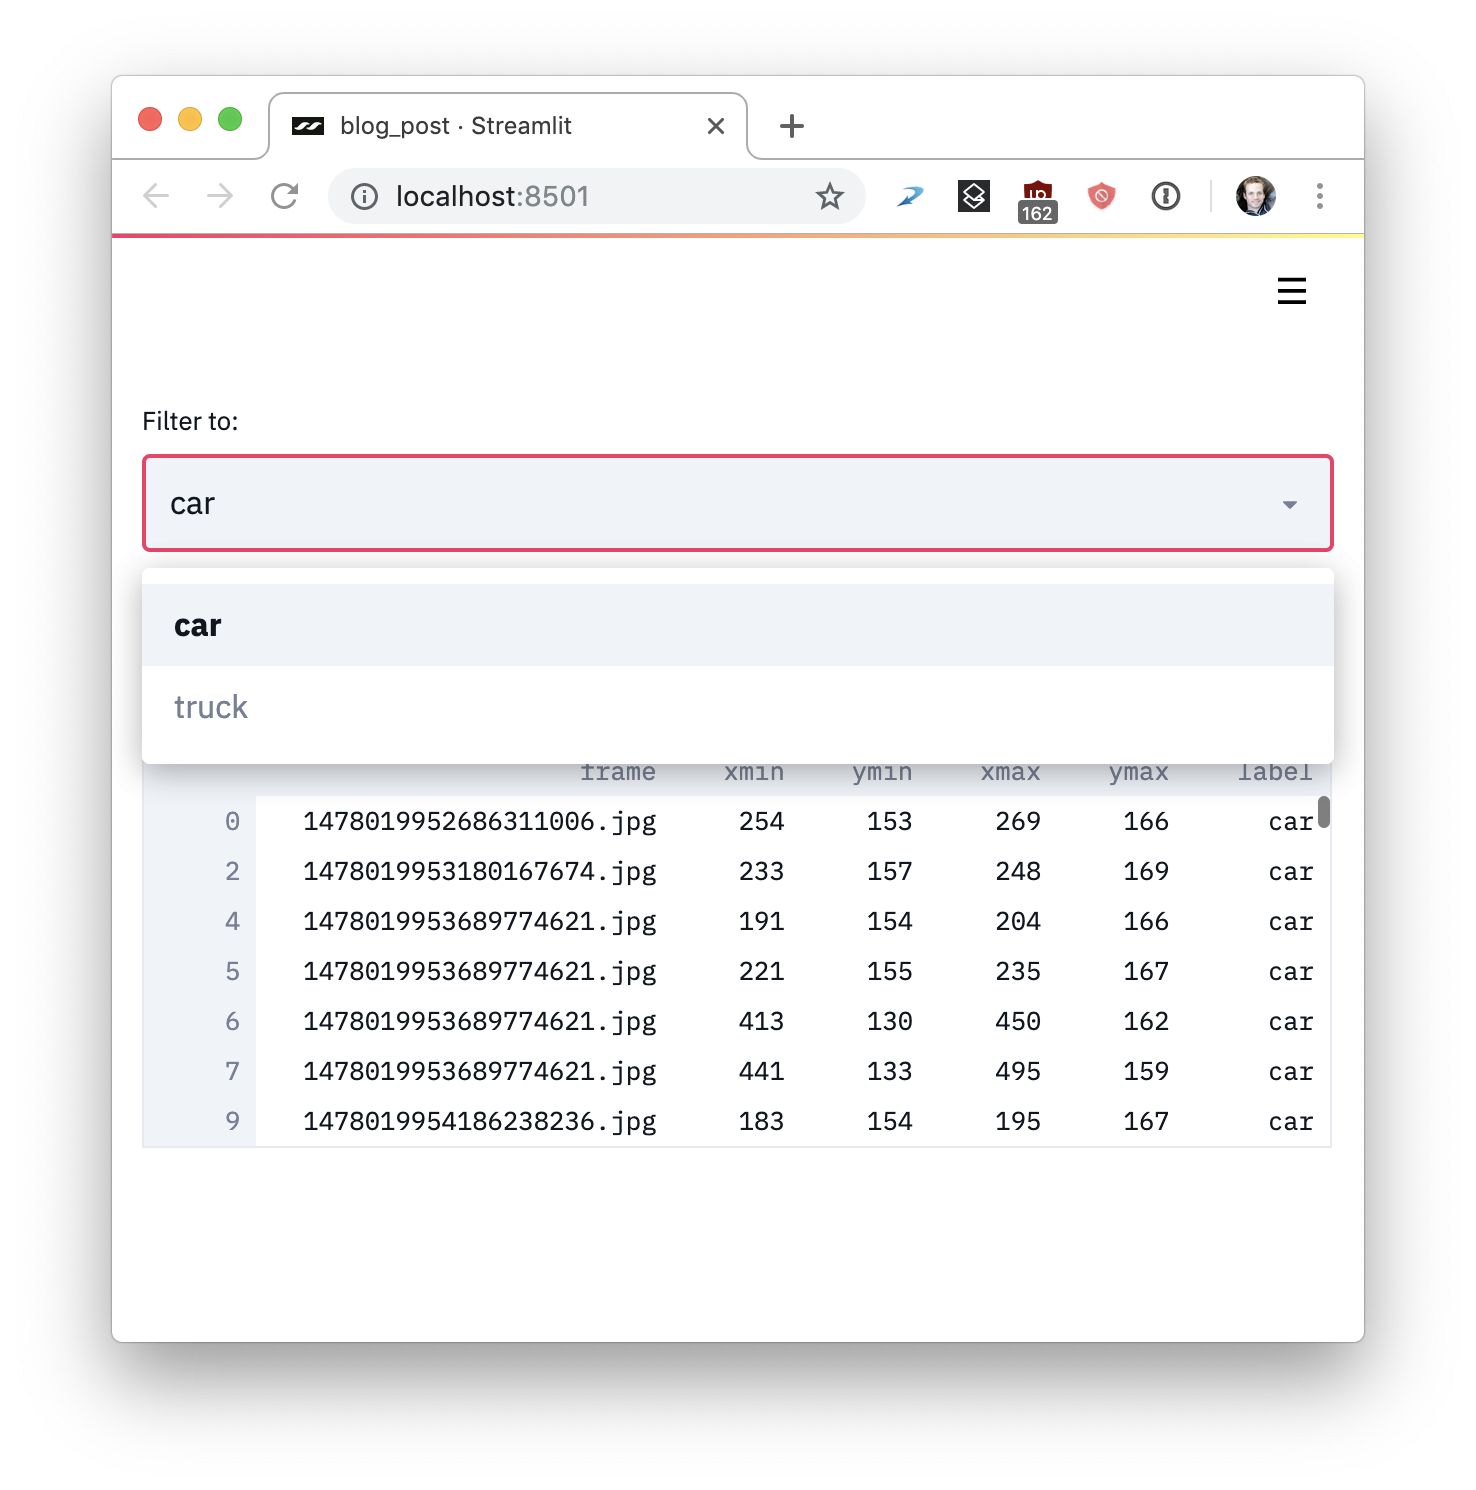
Now, let's go ahead and install Streamlit using pip:
pip install --upgrade streamlitOnce the installation is complete, use the following command to see a demo of an application with sample code:
streamlit helloNow you can see your application in your browser: http://localhost:8501
The simplicity of these ideas does not prevent you from creating incredibly rich and useful applications with Streamlit.
-
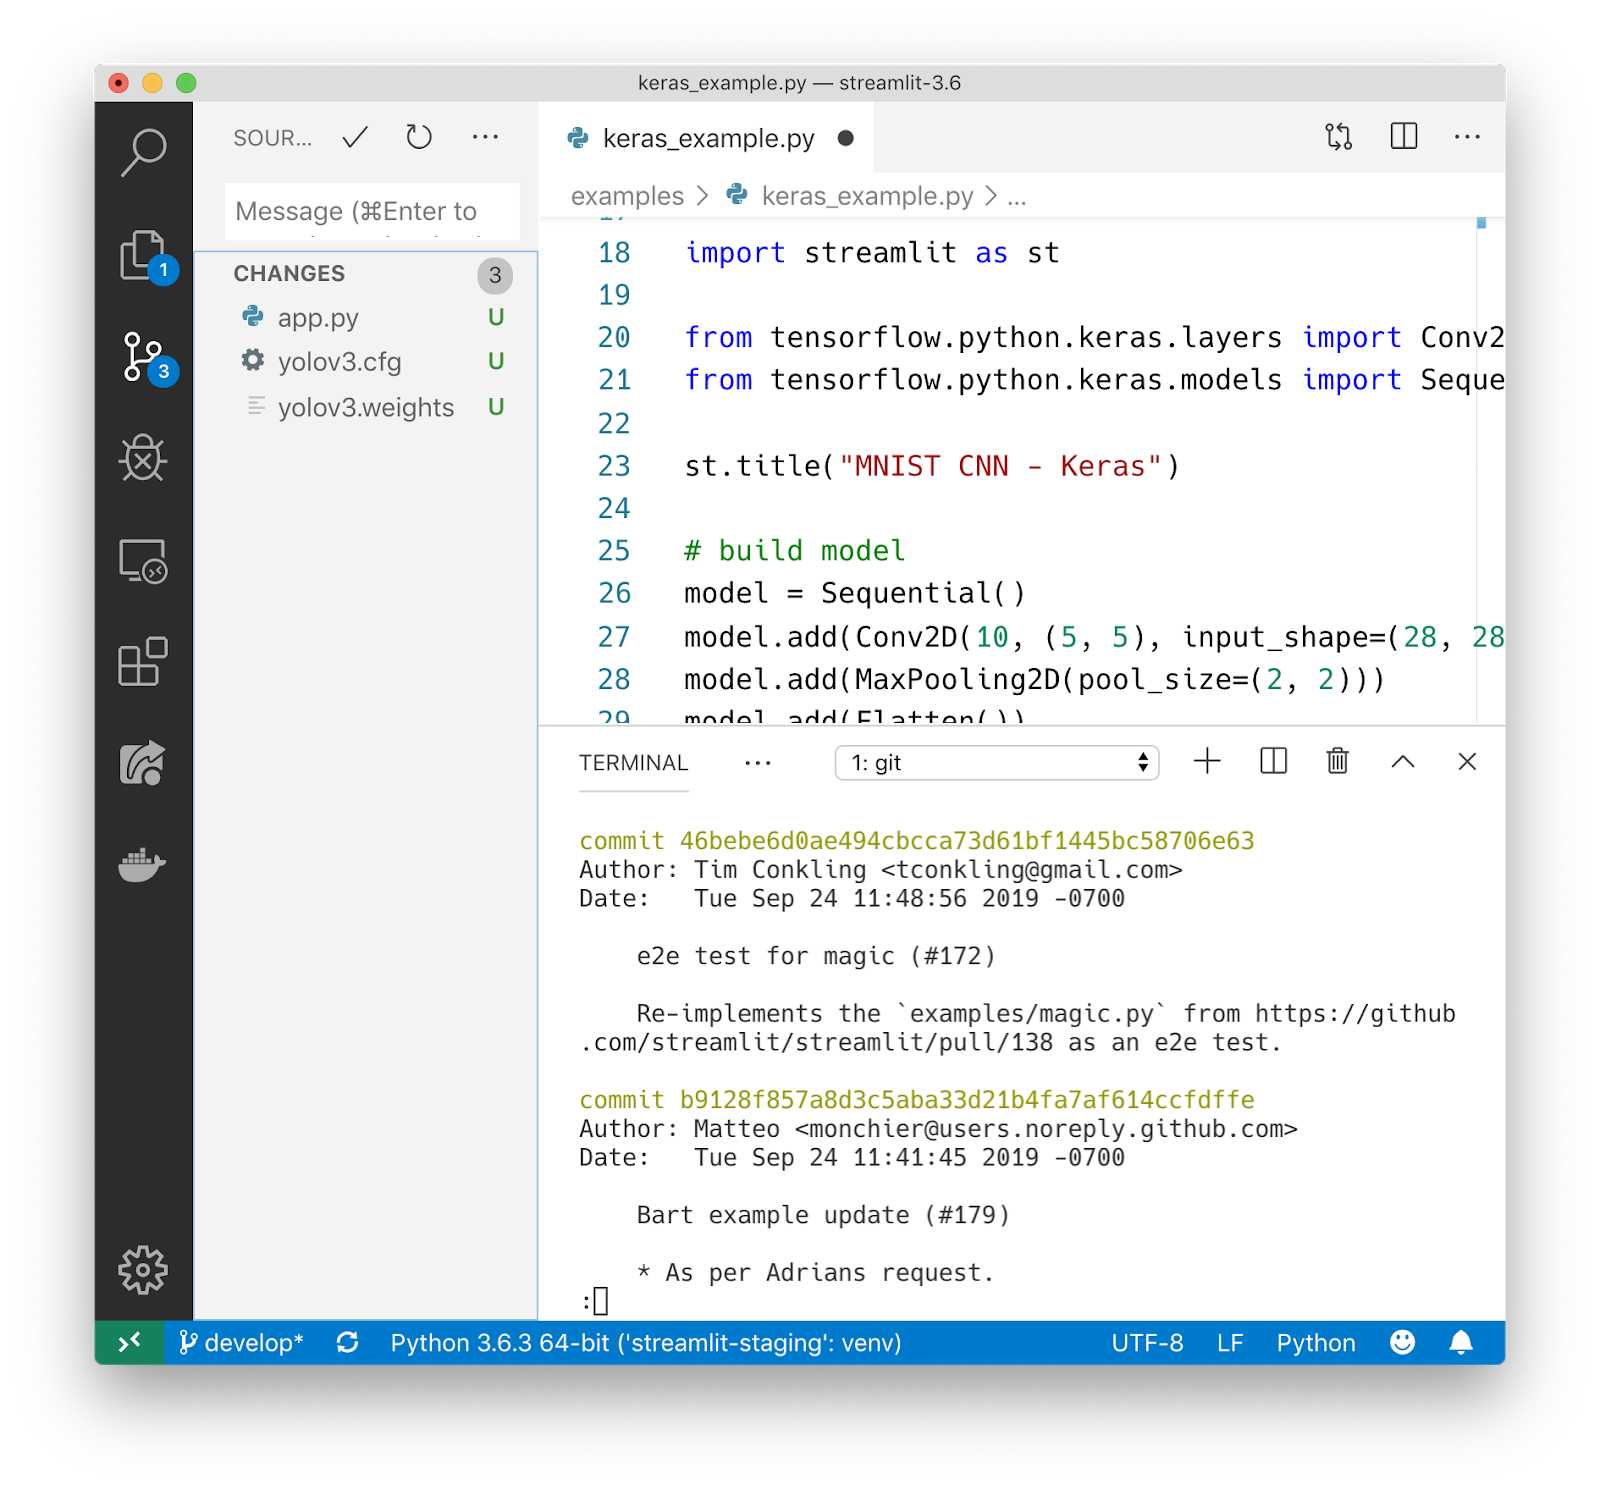
Streamlit applications are pure Python files. So you can use your favorite editor and debugger with Streamlit.
-
Pure Python scripts work seamlessly with Git and other source code control software, including commits, pull requests, issues, and comments. Because the underlying language of Streamlit is pure Python, you get all the benefits.
-
Streamlit provides an immediate live coding environment. Click
Rerunwhenever Streamlit detects a change in the source file. -
Streamlit is designed for GPU. Streamlit allows direct access to machine-level primitives like TensorFlow and PyTorch and complements these libraries.
Here we will explain some of the basic features, but for complete documentation of Streamlit, you can click on the following link: https://docs.streamlit.io/
Selection Widgets
There are many widgets available, including the following:
age = streamlit.selectbox("Choose your age:", np.arange(18, 66, 1))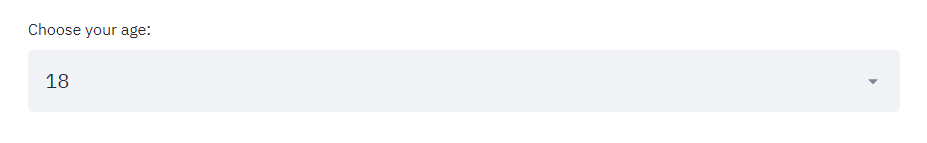
Another way of doing the same:
select = st.selectbox('Select a State',data['State'])The first parameter is the title of the selection box, and the second parameter defines a list of values that will be filled in the selection box. The second parameter is a "State" column name in the .csv file we loaded.
age = streamlit.slider("Choose your age: ", min_value=16,
                       max_value=66, value=35, step=1)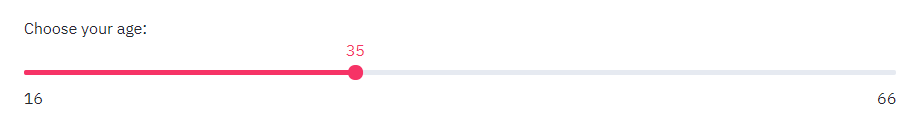
artists = st.multiselect("Who are your favorite artists?",
                         ["Michael Jackson", "Elvis Presley",
                         "Eminem", "Billy Joel", "Madonna"])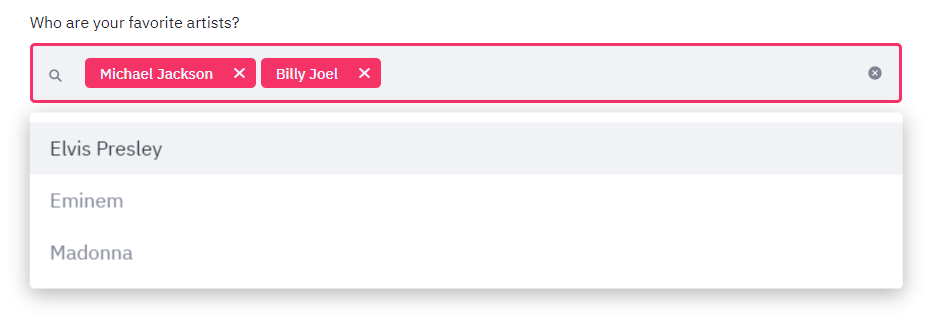
st.sidebar.checkbox("Show Analysis by State", True, key=1)The first parameter in the checkbox defines the title of the checkbox, the second parameter defines True or False if it is checked by default or not, and the third parameter defines the unique key for the checkbox.
The problem with many dashboard tools is that data is reloaded every time you select an option or change the page. Fortunately, Streamlit has an amazing option that allows you to cache data and only run it if it hasn't been run before. You can cache any function you create. This can include loading data, but also preprocessing it or training a complex model once.
import pandas as pd
import streamlit as st

@st.cache
def load_data():
    df = pd.read_csv("your_data.csv")
    return df

# Solo se ejecutará una vez si ya está en caché
df = load_data()Streamlit supports many visualization libraries, including: Matplotlib, Altair, Vega-Lite, Plotly, Bokeh, Deck.GL, and Graphviz. You can even upload audio and video!
import pandas as pd
import numpy as np
import altair as alt
import streamlit as st

df = pd.DataFrame(np.random.randn(200, 3), columns=['a', 'b', 'c'])
c = alt.Chart(df).mark_circle().encode(x='a', y='b', size='c',
                                       color='c')
st.altair_chart(c, width=-1)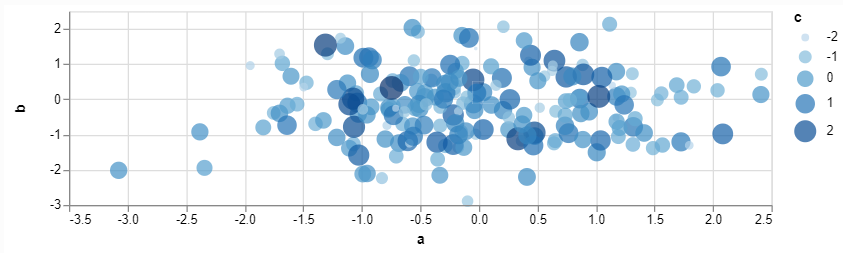
Another example:
def get_total_dataframe(dataset):
    total_dataframe = pd.DataFrame({
    'Status':['Confirmed', 'Active', 'Recovered', 'Deaths'],
    'Number of cases':(dataset.iloc[0]['Confirmed'],
    dataset.iloc[0]['Active'], dataset.iloc[0]['Recovered'],
    dataset.iloc[0]['Deaths'])})
    return total_dataframe
state_total = get_total_dataframe(state_data)
if st.sidebar.checkbox("Show Analysis by State", True, key=2):
    st.markdown("## **State level analysis**")
    st.markdown("### Overall Confirmed, Active, Recovered and " +
    "Deceased cases in %s yet" % (select))
    if not st.checkbox('Hide Graph', False, key=1):
        state_total_graph = px.bar(
        state_total,
        x='Status',
        y='Number of cases',
        labels={'Number of cases':'Number of cases in %s' % (select)},
        color='Status')
        st.plotly_chart(state_total_graph)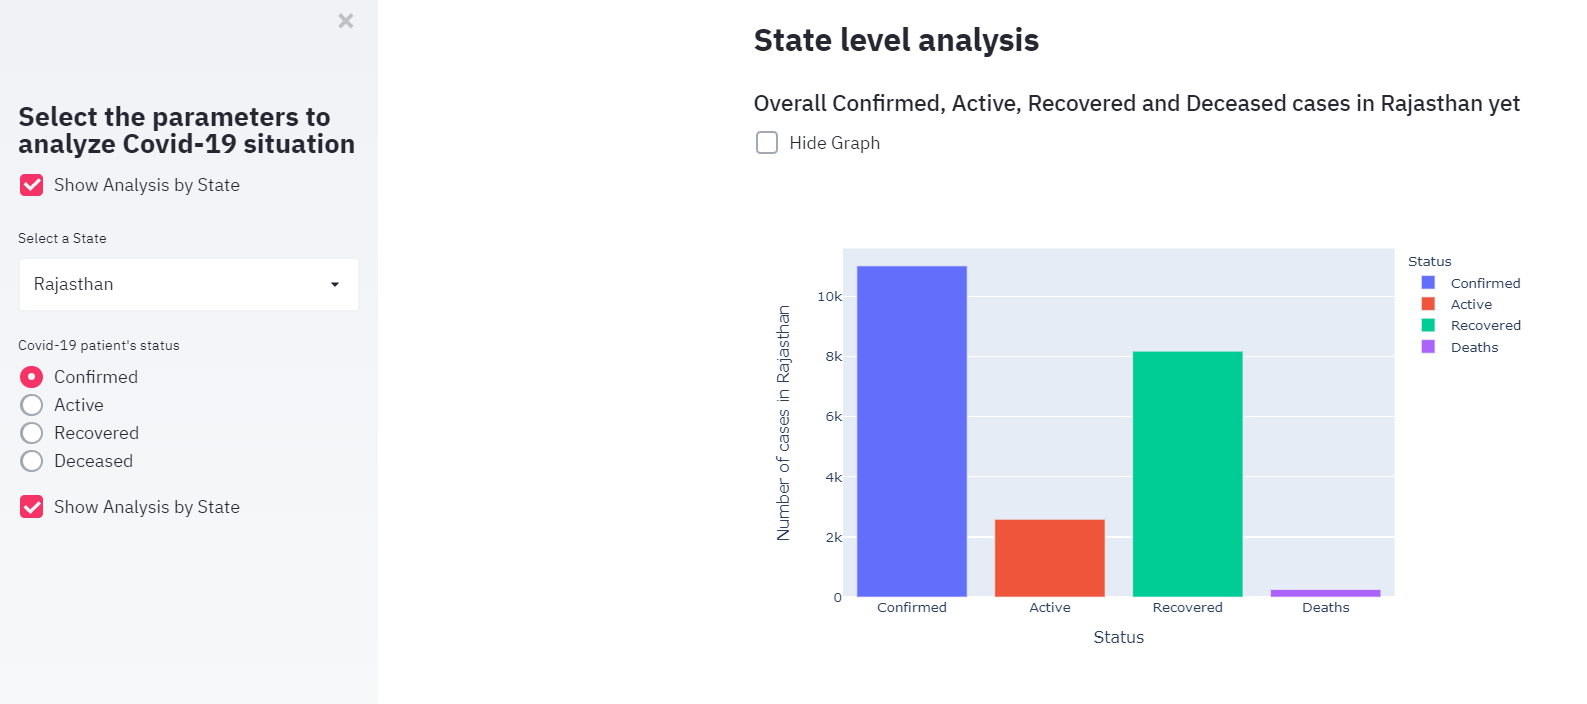
To plot the chart, we use the bar method from the plotly.express library. The first parameter is the dataframe we want to plot, the second parameter is the x-axis column, the third parameter is the y-axis column, the labels parameter is optional in case you want to rename a column for the chart, and the color parameter here is to color code the chart based on the State column of the dataframe.
We can generate Markdown and beautiful READMEs with a single function:
import streamlit as st
st.markdown("### 🎲 The Application")
st.markdown("This application is a Streamlit dashboard hosted on Heroku that can be used"
            "to explore the results from board game matches that I tracked over the last year.")
st.markdown("**♟ General Statistics ♟**")
st.markdown("* This gives a general overview of the data including"
            "frequency of games over time, most games played in a day, and longest break"
            "between games.")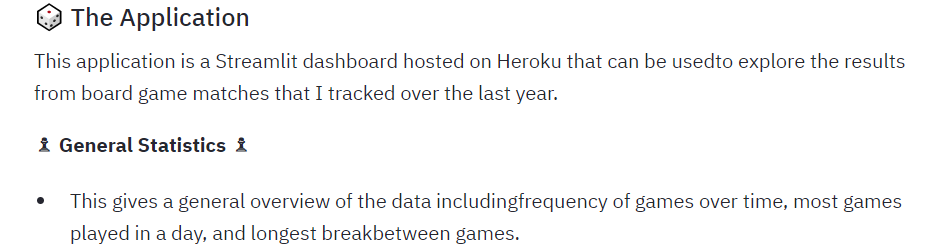
The write function behaves differently depending on its input. For example, if you add a Matplotlib figure, it will automatically display that visualization.
Some examples:
write(string) : Prints the formatted Markdown string.
write(data_frame) : Displays the DataFrame as a table.
write(dict) : Displays dictionary in an interactive widget.
write(keras) : Displays a Keras model.
write(plotly_fig) : Displays a Plotly figure.Let's see how we can create a very basic example web application. First, we'll create a Python file named app.py and import the libraries we will need.
import streamlit as st
import pandas as pd
import numpy as np
import plotly.express as px
Then we import the data:
@st.cache(ttl=60*5, max_entries=20)
def load_data():
    data = pd.read_csv('https://github.com/4GeeksAcademy/machine-learning-content/blob/master/assets/titanic_train.csv')
    return data

data = load_data()
In the load_data() method, we are reading the .csv file using the Pandas library, and we are making our code efficient by caching the data. If these data were to keep changing, we clear our cache every 5 minutes or for a maximum of 20 entries. If the data do not change frequently, we could simply use @st.cache(persist=True). The above code is an example, but for the Titanic model, we might keep persist=True.
Now let's create a title, some content, and a sidebar.
st.markdown('<style>description{color:blue;}</style>', unsafe_allow_html=True)
st.title('Titanic survival prediction')
st.markdown("<description>The sinking of the Titanic is one of the most infamous shipwrecks in history. " +
"On April 15, 1912, during her maiden voyage, the widely considered “unsinkable” RMS Titanic sank after colliding" +
"with an iceberg. Unfortunately, there weren’t enough lifeboats for everyone onboard, resulting in the death of " +
"1502 out of 2224 passengers and crew. While there was some element of luck involved in surviving, it seems some" +
" groups of people were more likely to survive than others. </description>", unsafe_allow_html=True)
st.sidebar.title('Select the parameters to analyze survival prediction')
The description is displayed in blue because we use HTML to give the custom color as blue. We can also use header and subheader as we use st.title() for different headings. Or we can use Markdown for that purpose.
Anything we call with the sidebar will be displayed in the sidebar.
Once you have finished creating your own application, you can run it using:
streamlit run app.pyNow that we have a very basic web application, we can show it to others by deploying it on Render.com. Of course, Render is not the only free option on the market. Alternatives are Azure, Heroku, Amazon EC2, and many others.
You're ready to start if you have already installed the Heroku Command Line Interface (CLI). If not, you can do so from here:
https://devcenter.heroku.com/articles/getting-started-with-python#set-up
This will help you manage your application, run it locally, view its logs, and more.
You can just open your cmd.exe and navigate to the application's folder.
Log in to Heroku with heroku login. You will be redirected to a login screen in your preferred browser.
While your cmd is open in the application folder, first run $ heroku create to create a Heroku instance.
Push all your code to that instance with git push heroku master
This will create a Heroku instance and send all the code from the application folder to that instance. Now, the application should be deployed.
With heroku ps:scale web=1, you ensure that at least one instance of the application is running.
Finally, run heroku open to open your application in the browser.
Additional Documentation can be found at: https://docs.streamlit.io/