can I set different colours for one line in Line chart? #100
Comments
|
Hi @tuwshuu0227 👋 Multiple lines can handled using 2 separate data arrays. For this you can use the However, the above chart may not be accomplished currently, even with 2 separate data arrays. I will work on this particular case soon. The support for negative values in Line and Area charts is now added in version Hope it helps.🤗 |
|
Hi @tuwshuu0227 👋 The props used to achieve this are -
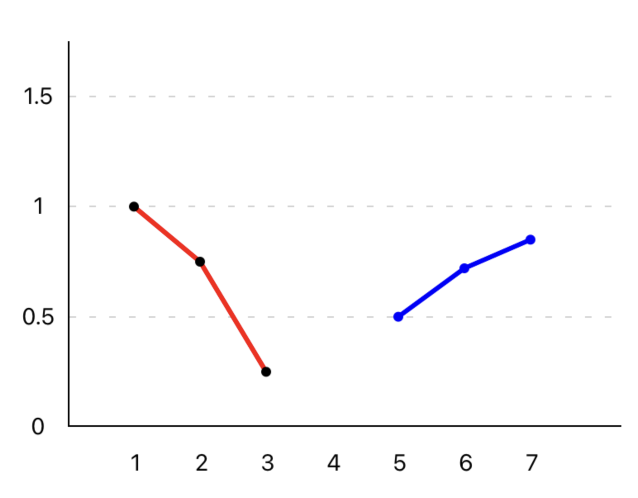
Let's say you want to render a chart like this -
The code for the above chart will be- const data = [
{value:1.0, label:'1'},
{value:0.75, label:'2'},
{value:0.25, label:'3'},
{value:0.00, label:'4'},
{value:0.50, label:'5'},
{value:0.72, label:'6'},
{value:0.85, label:'7'},
];
return(
<LineChart
data={data}
startIndex={0}
endIndex={2}
color1='red'
data2={data}
startIndex2={4}
endIndex2={6}
color2='blue'
showFractionalValues
maxValue={1.5}
noOfSections={3}
spacing={40}
thickness={3}
/>
)Hope it helps🤗 |
|
@Abhinandan-Kushwaha Hello there, thank you for your reply |
|
Hey @tuwshuu0227 Actually it's quite hard to implement this feature with the help of And worry not! we can now have upto 5 data sets simultaneously. 🎉 |
|
Hello @Abhinandan-Kushwaha |
|
Hi @tuwshuu0227 See #432 (comment) Here's an example- const MultiSegmented = () => {
const data = [
{value: 5},
{value: 8},
{value: 7}, // break in line from previous to this point
{value: 4},
{value: 6},
{value: 0, hideDataPoint: true}, // invisible, here's a break in the line
{value: 0, hideDataPoint: true}, // break continued
{value: 6},
{value: 9},
];
return (
<LineChart
spacing={35}
data={data}
lineSegments={[
{startIndex: 0, endIndex: 1, color: 'green'}, // 1st segmant from 0th to 1st index
{startIndex: 1, endIndex: 2, color: 'transparent'}, // break (transparent = invisible)
{startIndex: 2, endIndex: 4, color: 'red'}, // 2nd segment from 2nd to 4th index
{startIndex: 4, endIndex: 7, color: 'transparent'}, // 2nd break from 4th to 7th index
// remaining of the data points, from 7th to 8th index make the last segment
]}
/>
);
};The output of the above code is- 
|
|
Its seems if I use the Thank you in advance |
|
Hi @giltheodor |
can I set different colours for one line in Line chart? or can I cut line in Line chart?
Like this...
The text was updated successfully, but these errors were encountered: