To help their customers navigate large websites, many online retailers highlight their offerings by embedding suggestions in each webpage. Users strongly prefer that these advertised offers be tailored to their own interests: useless information creates clutter and detracts from their experience. Retailers, in turn, benefit from increased clickthrough and conversion-to-purchase when offers are strategically chosen for each user.
Retailers can leverage user behaviors like browsing activity, product ratings, and purchases to predict which offers a given user will find appealing. When the set of offers under consideration is relatively small and consistent over time, dense information on user responses to each offer accumulates. This input type is ideal for training classifiers, a machine learning model type with potential advantages including fast response time, lightweight representation, and explainable results.
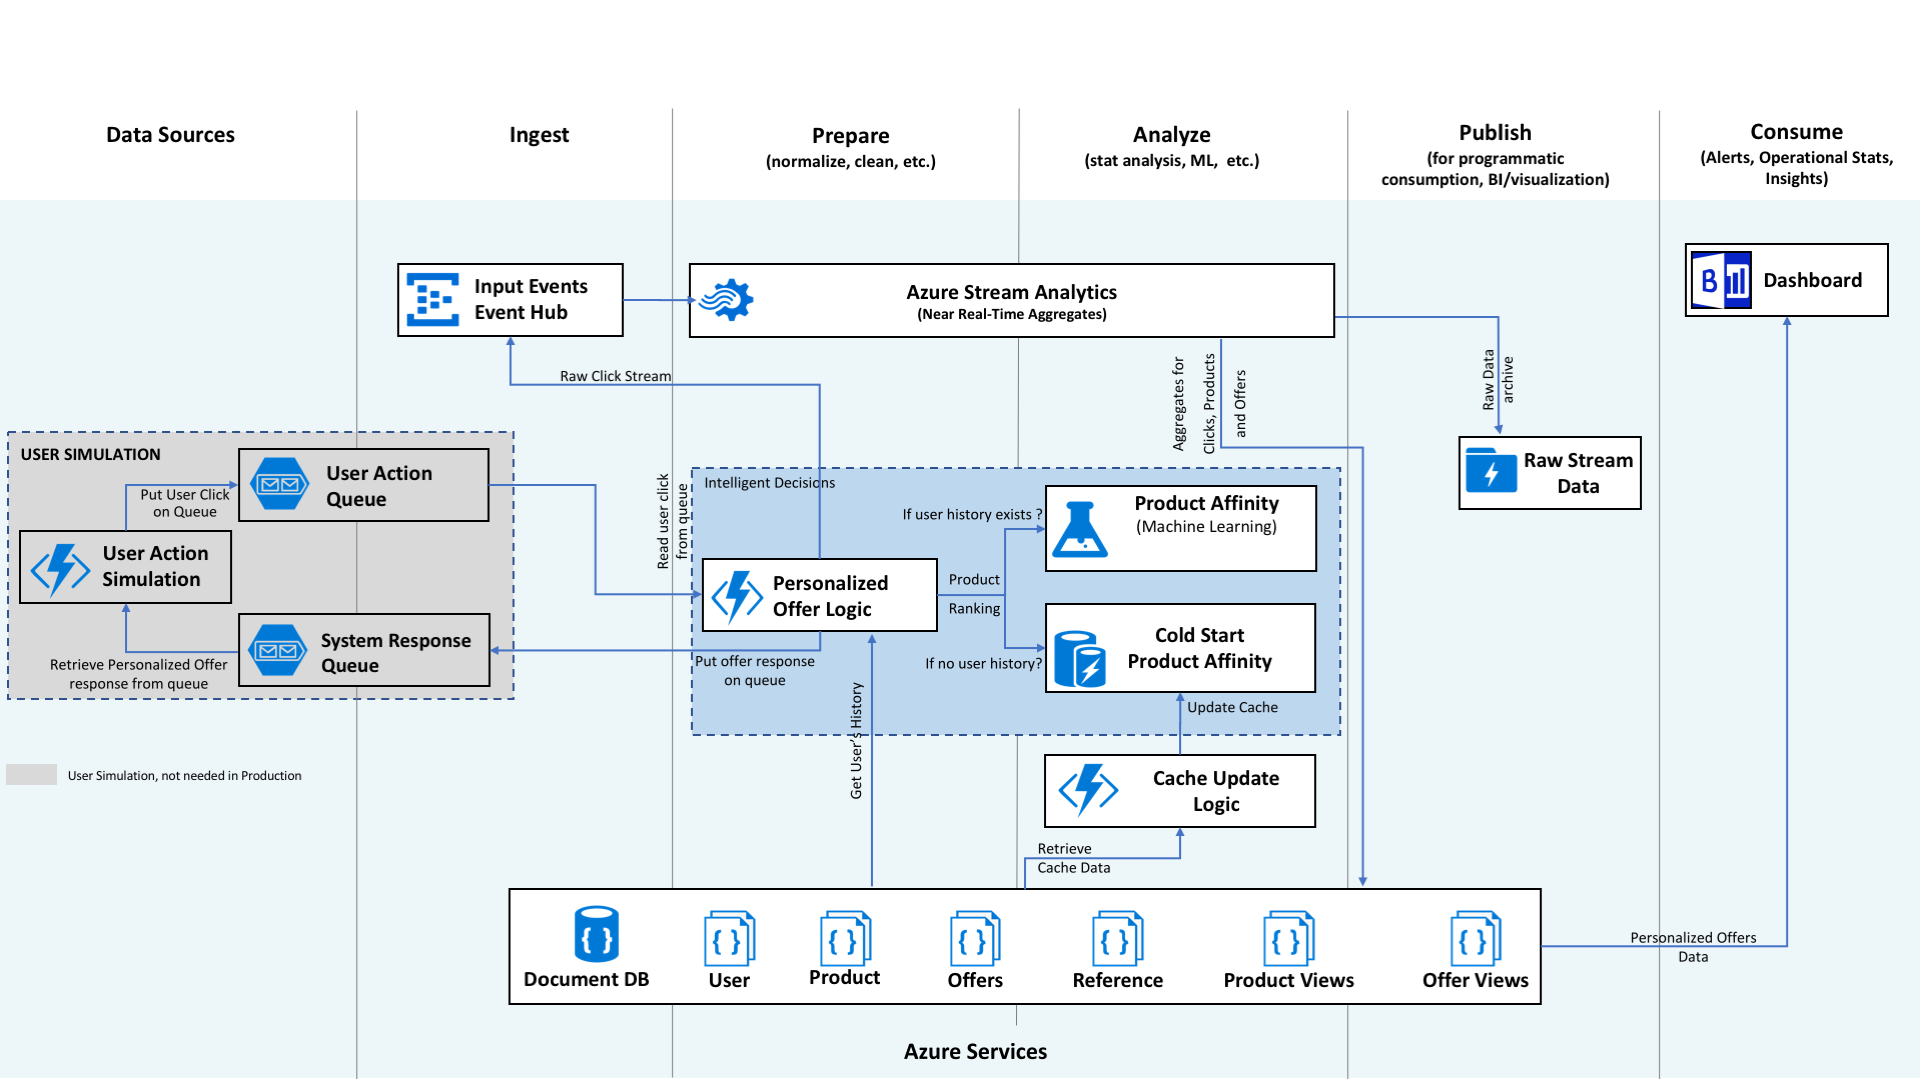
This document introduces data scientists and other industry professionals to best practices for offer personalization using classifiers. In addition to providing general advice, this document follows the use case from the Cortana Intelligence Solution How-To Guide on Personalized Offers as an illustrative example. A diagram of the Personalized Offers in Retail solution architecture is shown below for reference:
Contoso Mart is a fictitious online retailer with a selection of 25 products. The Contoso Mart website currently embeds one random offer -- an advertisement for a sale, a discount, or a specific product -- in each webpage on loading. Contoso Mart hopes to improve the offer clickthrough rate by displaying the offer deemed most appealing for each user based on the user's recent and longterm browsing history. Since the product selection is relatively static and small, Contoso Mart's records on user interactions with each offer are dense and well-suited for training a classifier model. Each stage of Contoso Mart's personalized offer development experience using the Personalized Offers solution will be highlighted in the appropriate section of this document.
- Data Acquisition
- Feature Extraction and Selection
- Classifier Model Selection
- Best Practices for Training and Evaluation
- Operationalization and Deployment
The first stage in implementation of a classifier for personalized offer recommendations is the collection of data that will be used to train the model. In particular, personalization requires collection of user-specific information such as interests, demographics, and behaviors. The data collected must be sufficient to construct labels (i.e. the value that the classifier will predict) as well as informative features that can be used to predict the labels.
Offer Clickthroughs
User responses to presented offers -- i.e., whether each offer was clicked or ignored -- constitute the most direct form of evidence for a user's interest or disinterest in an offer. In the most common data collection scheme, a retailer records each offer displayed to a user and each time an offer is clicked: these records can be compared later, using timestamps or unique URIs, to determine which offers were ignored. For simplicity, some retailers choose to record only clickthrough events. The number of offers and clickthroughs will likely vary between users; data summarization (e.g. counting all clickthroughs or fraction of offer displays resulting in clickthrough) can be used to create appropriate features.
Note that offer clickthrough data can only be collected after offer display on the retailer's website begins. A retailer can begin collecting data before an ML solution is implemented by displaying offers randomly or in a targeted fashion. If the distribution of offers displayed to each user is non-random, downsampling (or upsampling) may be used to balance the dataset.
Page Views
A user's browsing history may shed light on longterm preferences and current purchase intentions. Each visit to a given page adds evidence of a user's interest in the page's contents, which may correspond to interest in a related offer. A rolling tally of a user's views for each page can be maintained over any time frame of interest, with current values recorded at the time a clickthrough event is logged. Alternatively, each page view can be recorded directly in a log entry containing a timestamp and identifiers for the user and page, and rolling counts can be constructed from these logs.
Purchases, Product Reviews, and Wishlists
Interest in some types of offers -- in particular, product recommendations -- correlates with user interest in specific products. Records of users' purchases, reviews, and "wishlist" contents can be used to predict their interest in a product. Raw data of this type is likely to be sparse: for example, the probability that a user will purchase/review/etc. any given product is low. However, dense features appropriate for training classifier models can be constructed by summing across all products in defined categories.
Many online retailers request and store customer details that are likely to correlate with their interest in specific offers. For example, customers usually specify their location and gender-specific appellation when entering their shipping information during sign-up or check-out. Some retailers collect additional details like age and stated interests on an opt-in basis, encouraging broad participation by offering incentives. (Users may also volunteer this information once they are convinced that relevant offers will improve their browsing experience.) Additional information may be shared when users link social media accounts containing a user profile.
Contoso Mart sells twenty-five products. Every time a user requests the product description page for one of those products, an offer is embedded in the page. Before implementing personalized offers, Contoso Mart embedded an advertisement for a (different) randomly-selected product and recorded the following information for each offer display event:
- The product that was highlighted in the offer
- The webpage where the offer was displayed
- Demographics on the user including location (latitude/longitude), distance from a retail store, gender, auto-renew status, and credit card type
- The offered product's weight and cost
- The count of the user's visits to the offered product's webpage in the past minute, hour, or day (tallies maintained in near-real time using Azure Event Hub and Azure Stream Analytics)
- Whether a clickthrough occurred
Because the product offered and webpage displayed are categorical values, each effectively contributes 25 one-hot features to the classification model. If the number of products/web pages were larger, this might have resulted in a model with an untenably large number of features: in that case it might have been advisable to bin products into groups or switch to a hybrid recommender approach.
The core component of the model training/evaluation datasets is the offer clickthrough data, which generally contains the label of interest (viz., whether the user clicked on the offer), the identifier for the user who clicked it, and sometimes a timestamp. The user identifier and timestamp can be used to join the dataset with semi-static user descriptions like demographic properties as well as the user's recent behavior at the time the clickthrough occurred. This process may produce a dataset that includes many features, some of which are uninformative or contribute to overfitting. Feature selection can be used to reduce the feature set while maintaining as much predictive power as possible.
Rolling windows
Raw event logs typically include information on only one event per row. Rolling window techniques can be applied to these logs to create new features that count the number of events which occurred in the n minutes prior to each timepoint. We can then outer join these logs with the main dataset by timestamp (and, if necessary, forward-fill) to annotate the clickthrough data with the relevant rolling event counts. This technique can be used to create potentially-useful features such as "number of user's visits to page x in last hour".
Data scientists who introduce rolling counts during feature extraction must give careful thought to how these features will be computed after the model is deployed. The calculations which they perform to construct features during offline model development may not be ideal in the time-sensitive context of the operationalized model. Data engineers and solution architects can help design a solution for near-real time calculation of these rolling counts, so that they can be provided directly as inputs to the model. If a processing delay is expected for rolling count calculation, that delay can be simulated during offline feature creation, so that the model's performance during formal evaluation will more closely track its performance on new data after deployment. (Once the solution is operational, rolling counts can be stored with other details of each offer clickthrough, and will no longer need to be generated offline through feature extraction.)
Inferred User Descriptors
User descriptors are most useful when they have low "missingness" (fraction of data points with unknown value). Most online retailers collect user interest and demographics on an opt-in basis, resulting in high missingness. The utility of these features can be improved by filling in missing information with data obtained from a third party, or with an educated guess, e.g. through imputation or classification. For example, information that is commonly provided for shipping purposes, like name and location, could be used to infer other properties like gender, socioeconomic status, or age.
Uninformative features should be identified and removed to reduce the potential for model overfitting. Undesirable features can be identified by computing correlation or mutual information with the label, performing forward selection or backward elimination, or by using a variety of model-specific approaches (e.g. feature importance for decision forests). Perfectly-predictive features such as unique user identifiers should also be removed prior to model training. For some feature selection methods, it is preferable to use a subset of training data, either defined explicitly or created through cross-validation (please see the Dataset Partitioning section for more information), to ensure that model performance during evaluation reflects likely performance after deployment.
Contoso Mart merges all features of interest into the offer clickthrough data during the logging step, ensuring that the model is trained only on features that will be readily available after deployment. Rolling counts of recent page views are maintained using Azure Stream Analytics and Azure Event Hub.
Binary classifiers assign one of two possible labels to a given data point based on the values of relevant features. Multiclass classifiers extend this concept, creating a model that assigns one of 3+ labels for each data point. In this use case, Contoso Mart trained a binary classifier to predict whether a given displayed offer would result in a clickthrough. Other retailers may elect to train a multiclass classifier to predict the best of several offer options to display.
Major advantages of classifiers over alternatives like hybrid recommendation models include their potentially faster speed, lower resource requirements, and improved explainability. However, classifiers are challenged by the introduction of new classes and very large numbers of classes. (Hybrid recommendation models may then be preferable: see the following example use case.)
Common types of classifier models include:
- k-Nearest Neighbors
- Logistic Regression
- Naive Bayes
- Kernel Machines (e.g. Support Vector Machines, Bayes Point Machines)
- Random (Decision) Forest
- Decision Jungle
- Neural Network
A number of characteristics should be considered when selecting a classification model:
- Accuracy of the predictions
- Training and scoring speed
- Training and scoring resource requirements
- Availability of confidence metrics for predictions
- Availability of methods for assessing feature importance
- Availability of model-specific methods to reduce overfitting
- Ability to succinctly explain results
For a detailed comparison of several classifier models, please see our broader discussion of algorithm selection or Martin Thoma's blog post on Comparing Classifiers.
Multiclass classifiers can be constructed from sets of binary classifiers in two common ways:
One vs. One
Under this scheme, an n-class classifier is constructed from n-choose-2 = n(n-1)/2 binary classifiers. Each binary classifier fij: X -> { i, j } is trained using the subset of training data points with label i or j. The label assigned by the multiclass classifier is the most common label assigned by the set of binary classifiers. Disadvantages of this scheme include the quadratic growth in number of required classifiers with n, and the potential ambiguity when the same number of classifiers support 2 or more most common labels.
One vs. All
An n-class classifier can also be constructed from n binary classifiers, provided that the classifier returns a score indicating confidence (in addition to an assigned label) for each data point. Each classifier fl: X -> R is trained to return a value indicating its confidence that a data point x has label l. Data points are assigned the label corresponding to the most confident classifier, i.e. f(x)= arg max*l fl(x)*. A disadvantage of this approach is that it requires a classifier type that can assure similarly-scaled confidence scores and increase the probability that classifiers will be trained on imbalanced datasets.
Some binary classifier models have also been extended (with model-specific algorithms) to allow efficient training and scoring without explicitly constructing binary classifiers as described above.
Azure Machine Learning (AML) Studio is a cloud-based graphical environment for machine learning data preparation and model development. Many of the multiclass classifier models mentioned above can be incorporated into AML through a code-free drag-and-drop interface, but data scientists can also import R and Python code to implement custom model types if they prefer. During model development, intermediate results can be examined using automated summaries, or custom code and visualizations in Python/R Jupyter notebooks. AML also facilitates deployment of predictive web services from trained models. Data scientists can share their work and find examples of models constructed in AML Studio in the Cortana Intelligence Gallery.
Azure App Services is another option for the deployment of models trained locally. Data scientists can create predictive web services using a wide variety of programming languages and common tools like Flask, Django, and Bottle. The Web App Service can also be used for the construction of web pages that make use of the web service.
Contoso Mart chose to implement their classifier model using Azure Machine Learning Studio. A shared experiment showing their model training, scoring, and evaluation process can be found in the Cortana Intelligence Gallery.
Contoso Mart selected a two-class boosted decision tree model based on the following desired features:
- Fast training and scoring
- Low resource requirements
- Explainable results
- Availability of feature importance metric (Gini)
This type of binary classifier is one of many available as a built-in module in AML. Contoso Mart was able to easily compare and contrast the performance of different model types by swapping them into the experiment graph. If Contoso Mart had preferred to use a different model type, they could have used a user-contributed custom module available in the Cortana Intelligence Gallery, or scripted their own using R, Python, or C#.
Recognizing that their model would likely suffer from the "cold start problem" -- difficulty making recommendations for new users or offers -- Contoso Mart designed their solution architecture so that offers displayed to new users would be determined by separate, coded logic rather than using the trained machine learning model. This alternative offer display logic is implemented using Azure Functions.
It is common practice to partition the available data points into two sets: a training set used to select hyperparameters/features (if applicable) and train the model, and a test set for evaluating the trained model's accuracy. This practice improves the odds that a model's performance on the test set will accurately reflect its performance on future data.
Random splitting of observations into training and test sets may not be ideal for model evaluation. When data points collected from the same user appear in both the training and test set, the model may learn their specific behaviors and thus give more accurate predictions for them than it would provide for new users. To ensure that the model generalizes well, it may be wise to partition data points at the user level during model evaluation. Once a model's performance is determined to be satisfactory, the model can be retrained using all available data to maximize performance on all current users after deployment.
Another common partitioning method is to divide observations chronologically: observations collected before a certain date would form the training set, and all more recent observations would form the test set. This arrangement mimics the real-world scenario in which the model is trained on all data available on a certain date, then tested on new data as it arrives. The performance of the trained model on the test set is realistic in the sense that the model will have no knowledge of any trends that arise after the training date. (By contrast, if the data were partitioned randomly, a model would likely be trained using some data points from every time period, and therefore could "learn" all such trends.) If the model's performance on the evaluation set is acceptable, the model may be retrained using the full dataset before deployment.
Some classification models take hyperparameters that tune properties such as strength of regularization, learning rate, and number of training rounds. (For more information on which hyperparameters are available for a given classification model, see the documentation for the machine learning model implementation. Descriptions of classification models in AML Studio can be found here.) A range of possible hyperparameter values can be tested to identify the values that produce models with optimal performance on a withheld portion of the training set (usually called a "validation" set), which may be statically-defined or varied via cross-validation. In AML Studio, the Tune Model Hyperparameters module can be used to automate hyperparameter selection using cross-validation.
After the test set has been scored using the trained model, the predicted and actual data point labels can be compared using a variety of metrics:
Overall and average accuracy
The overall accuracy is the fraction of data points where the predicted and actual labels match. For a test dataset X with predicted labels Y, let Xl denote the set of points with true label l, and Fl denote the set of points with predicted label l. We can then express the overall accuracy using a sum over the n labels:

where |X| denotes the size of set X.
An alternative metric is defined in terms of the class-specific accuracies, i.e., the fraction of all data points that are correctly labeled as belonging or not belonging to each class:

The average accuracy is the unweighted average of the class-specific accuracies:

When predictions on a minority class are substantially worse than other predictions -- which may be caused by the small number of training points available -- the average accuracy will be more deeply impacted than the overall accuracy. Average accuracy is therefore useful for highlighting low accuracy in rare classes.
Confusion matrix
The confusion matrix C summarizes the number of data points in the test set with each combination of true and predicted labels. Each element Clm of the confusion matrix is number of data points with true label l that were predicted to have label m.
As an example, for the following simple dataset and labels:
| True label | Predicted Label |
|---|---|
| 1 | 2 |
| 1 | 1 |
| 2 | 3 |
| 3 | 3 |
| 1 | 1 |
The corresponding confusion matrix would be:
| 1 | 2 | 3 | |
|---|---|---|---|
| 1 | 2 | 1 | 0 |
| 2 | 0 | 0 | 1 |
| 3 | 0 | 0 | 1 |
A perfect predictor would produce a diagonal confusion matrix; any non-zero off-diagonal elements correspond to prediction errors. Confusion matrices can be visually inspected or summarized further using metrics like precision and recall.
Recall
The model's recall for a class l is the fraction of data points in Xl that were predicted to be in class l:

There are two common methods for summarizing recall across all classes. The macro-averaged recall is the (unweighted) average class recall:

The micro-averaged recall, by contrast, is the weighted average of the class recalls (with fraction of all datapoints in each class used as the weighting):

The micro- and macro-averaged recall are identical for balanced datasets. In imbalanced datasets, poor recall on a minority class has a more dramatic effect on macro- than micro-averaged recall.
Precision
The model's precision for a class l is the fraction of data points predicted to be in class l that are truly in class l:

As with recall, precision for multiclass classifiers can be calculated using micro- or macro-averaging:

For additional description of these and other metrics, see Computing Classification Evaluation Metrics in R by Said Bleik.
Contoso Mart uses Azure Machine Learning Studio to train and evaluate its classifier. The metrics and confusion matrix described above are automatically generated by the Evaluate Model module, and can be inspected by right-clicking on the module's output port to select the visualization option. If desired, Contoso Mart could also calculate arbitrary metrics of interest using Python and R scripts they create or find online.
For additional information on model evaluation in AML Studio, please see Gary Ericson's How to evaluate model performance in Azure Machine Learning
After evaluation reveals that a trained model is fit for operationalization, a web service can be created to surface its recommendations. Depending on how the web service is deployed, it may be necessary to explicitly define the web service's input and output schema, i.e., the input data format needed to call the web service, and the format of the results to be returned. In Azure Machine Learning Studio, a predictive web service can be created from a trained model with a single click and tested using a graphical interface, Excel plug-in, or automatically-generated sample code. Developers using Azure Web Apps can also use common web service creation tools like Flask, Bottle, and Django.
Many retailers pre-generate personalized offer recommendations from the web service for each user, and store these recommendations for fast incorporation during webpage rendering.
Since personalized offers often contribute significantly to revenue and are displayed prominently, online retailers may wish to gradually introduce a new recommendation model to ensure that performance and quality meet expectations. In the A/B testing scheme, the new model's suggestions can be served to a small subset of users while the previous model continues to be displayed to the majority. Offers provided to the two user groups can then be compared on metrics like loading speed, error rate, and clickthrough rate to ensure that the new model is equally reliable and offers superior product suggestions.
Multiworld Testing is an extension of A/B testing that permits multiple models to be tested concurrently, with automated selection of effective models. The Multiworld Decision Service simplifies the process of incorporating this form of testing into a web application.
The classifier should be retrained as the selection of available offers changes and additional training data accumulate. This retraining step may be supervised manually by a data scientist or performed programmatically. If desired, the retrained model can be compared directly to the previous model using A/B testing before it is fully deployed. More information on programmatic retraining in Azure Machine Learning Studio is available here: Retrain Machine Learning models programmatically.
Contoso Mart uses one-click deployment to create a predictive web service based on their trained model:

Each time a user requests to load a web page, Contoso Mart's Azure Function calls the web service to predict whether the user would click on an offer for each of the 25 products. The web service returns the probability of clickthrough for each product, which Azure Functions uses to identify the three products of greatest potential interest to the customer. The Azure Function uses this information, along with rules provided by the retailer about which offers to prioritize, to choose the final offer to be displayed. Finally, the offer selected by the Azure Function is embedded into the webpage. Contoso Mart could also precalculate and store offer recommendations for each user to further reduce latency.
To monitor the personalized offers' efficacy, Contoso Mart continues to record all clickthrough events to Azure Blob Storage, from which they are regularly transferred to DocumentDB for long-term storage, analysis, and display via a Power BI dashboard.