[PROF-3321] Fix CPU-time accounting when fibers are used #1636
Conversation
Since this method is being called at stack sampler startup, threads
that previously were not touched were going to get written to anyway
on the next sample.

The one exception/behavior change is if cpu time profiling is
disabled or unavalable for some reason -- we would previously never set
the `THREAD_LAST_CPU_TIME_KEY` for threads in that case, but I don't
think it's worth having this distinction, so I'll take the simpler
implementation and tests instead.
The Ruby `Thread` API has a really sharp edge around `Thread#[]` and
`Thread#[]=`: these methods are "not thread-local but fiber-local".
The documentation even goes as far as calling this "a confusion", see
<https://rubyapi.org/3.0/o/thread#method-i-5B-5D>.

Our CPU-time tracking was suffering from this confusion. Because it
was using `Thread#[]`/`Thread#[]=`, if a thread switched between
fibers, our CPU-time tracking started miscounting time.

E.g., consider the following test application:

```ruby
def fake_cpu_time(n)
  Thread.pass
  sleep 0.01
  Thread.pass
  puts "Fiber #{n} yielding..."
  Fiber.yield :frozen
  puts "Fiber #{n} resumed..."
  Thread.pass
  sleep 0.005
  Thread.pass
  sleep 0.005
  Thread.pass
end

def start_fibers
  fibers = (0..1000).map do |n|
    Fiber.new do
      fake_cpu_time(n)
    end
  end
  run_fibers(fibers)
  fibers
end

def actually_do_cpu_work
  puts "Starting cpu work"
  start = Time.now
  nil while Time.now < (start + 28)
  puts "Finished cpu work..."
end

def run_fibers(the_fibers)
  the_fibers.each(&:resume)
end

the_fibers = start_fibers
actually_do_cpu_work
run_fibers(the_fibers)
```

The following happens in this example:

1. It starts 1000 fibers, using `Thread.pass`+`sleep` to try to give
   the profiler a chance to run and sample them.
2. Because `Thread#[]=` is fiber-local, every fiber that is sampled
   gets its own copy of `THREAD_LAST_CPU_TIME_KEY`
3. Then the example switches back to the original fiber, and does
   some CPU-heavy work for around 28 seconds
4. The example app then runs through every fiber again, using
   `Thread.pass`+`sleep` to give the profiler a chance to sample
   every fiber.
5. While sampling, the profiler will observe that the current cpu
   time for on every fiber has advanced 28 seconds from the last value
   stored in the `THREAD_LAST_CPU_TIME_KEY`
6. Profiler will report that the same thread will have spent hours
   of CPU time in a 1-minute period. (In my experiment, it reported
   close to 2 hours, 40 minutes).

The fix here is simple: switch to using the
`Thread#thread_variable_get` and `Thread#thread_variable_set` APIs,
which give us the intended behavior: even across multiple fibers,
we just keep a single value for the same thread, and thus we get the
expected ~28s of cpu-time in the test application.
|
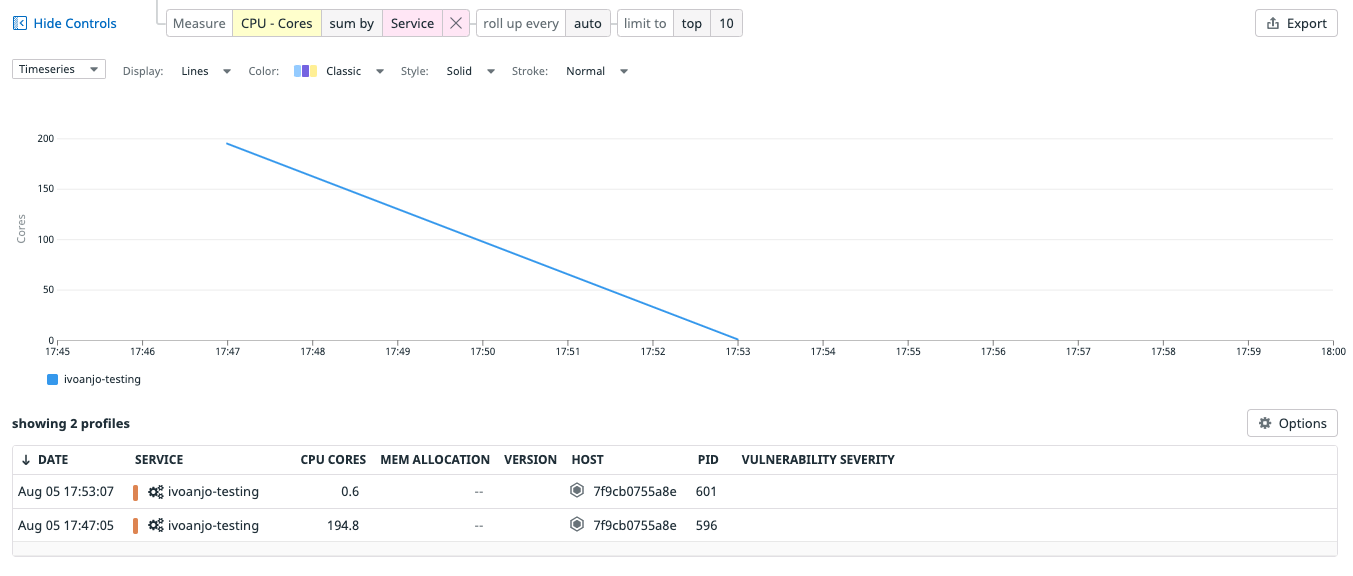
Alternative title for this PR: This One Ruby Trick Will Improve Your Cpu Usage By 200x:
|
Codecov Report
@@            Coverage Diff             @@
##           master    #1636      +/-   ##
==========================================
- Coverage   98.30%   98.30%   -0.01%
==========================================
  Files         901      901
  Lines       43541    43532       -9
==========================================
- Hits        42805    42796       -9
  Misses        736      736
Continue to review full report at Codecov.
|

There was a problem hiding this comment.
Nice catch, we'll likely have to do similar analysis for the tracer as well.
This analysis is on our radar, specially because newer releases of graphql use fiber, and we know there's an impact with the tracer's current implementation. (Doesn't mean we can just flip it to thread_variable_* without due diligence 😅)
|
Yeah, for the tracer it's actually non-trivial as we may actually want a mix of fiber-local and thread-local. For instance, "current span" probably makes sense to be fiber-local -- if I start a span in a fiber, and then switch fibers, I should probably not be inside the same span. |
|
It occurred to me that this was a really simple change, but the resulting performance impact may be non-trivial, so I wrote up a quick benchmark, which I tested on require 'benchmark/ips'
OTHER_THREAD = Thread.new { sleep }
Benchmark.ips do |x|
x.config(:time => 5, :warmup => 2)
x.report("fiber-local-set") { OTHER_THREAD[:foo] = 1}
x.report("thread-local-set") { OTHER_THREAD.thread_variable_set(:foo, 1) }
x.compare!
end
Benchmark.ips do |x|
x.config(:time => 5, :warmup => 2)
x.report("fiber-local-get-non-existing") { OTHER_THREAD[:non_existing] }
x.report("thread-local-get-non-existing") { OTHER_THREAD.thread_variable_get(:non_existing) }
x.compare!
end
Benchmark.ips do |x|
x.config(:time => 5, :warmup => 2)
x.report("fiber-local-get-existing") { OTHER_THREAD[:foo] + 1 }
x.report("thread-local-get-existing") { OTHER_THREAD.thread_variable_get(:foo) + 1 }
x.compare!
endand indeed there is a performance difference! on the other hand, we're still talking many millions per second, so I'm confident this will not have a noticeable impact (we do way more expensive things in the sampling loop). |
The Ruby
ThreadAPI has a really sharp edge aroundThread#[]andThread#[]=: these methods are "not thread-local but fiber-local".The documentation even goes as far as calling this "a confusion", see https://rubyapi.org/3.0/o/thread#method-i-5B-5D.
Our CPU-time tracking was suffering from this confusion. Because it was using
Thread#[]/Thread#[]=, if a thread switched between fibers, our CPU-time tracking started miscounting time.E.g., consider the following test application:
The following happens in this example:
Thread.pass+sleepto try to give the profiler a chance to run and sample them.Thread#[]=is fiber-local, every fiber that is sampled gets its own copy ofTHREAD_LAST_CPU_TIME_KEYThread.pass+sleepto give the profiler a chance to sample every fiber.THREAD_LAST_CPU_TIME_KEYThe fix here is simple: switch to using the
Thread#thread_variable_getandThread#thread_variable_setAPIs, which give us the intended behavior: even across multiple fibers, we just keep a single value for the same thread, and thus we get theexpected ~28s of cpu-time in the test application.