This post is Part 3 of a 4-part series about Kubernetes monitoring. Part 1 discusses how Kubernetes changes your monitoring strategies, Part 2 explores Kubernetes metrics and events you should monitor, this post covers the different ways to collect that data, and Part 4 details how to monitor Kubernetes performance with Datadog.
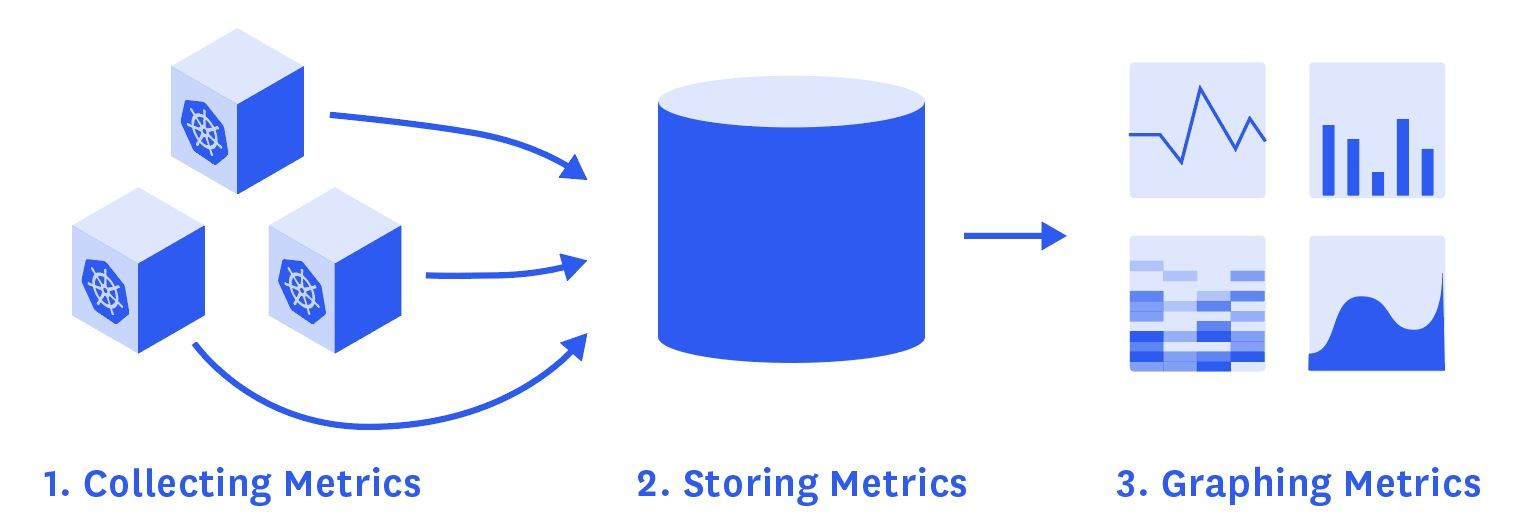
Part 2 digs into the different data you should track so you can properly monitor your container infrastructure as orchestrated by Kubernetes. In this post you will learn how you can manually set up metric collection, storage, and visualization using free, open source tools.
As briefly introduced in Part 2, Heapster is for now the go-to source for basic resource utilization metrics and events (read and exposed by Eventer) from your Kubernetes clusters. Here is how it works.
On each node, cAdvisor collects data about running containers that Heapster then queries through the node’s kubelet.
cAdvisor is an open source agent that is integrated into the kubelet of a node. It automatically discovers all the containers running, and collects data about them: CPU, memory, file system, network… It also collects data about itself and the Docker daemon. The kubelet exports these data and re-exposes them via API.
Heapster runs as a pod on Kubernetes like any other application. Its pod discovers all the nodes in the same cluster and then pulls metrics from the kubelet of each node, aggregates them by pod and label, and reports metrics to a monitoring service or storage backend.
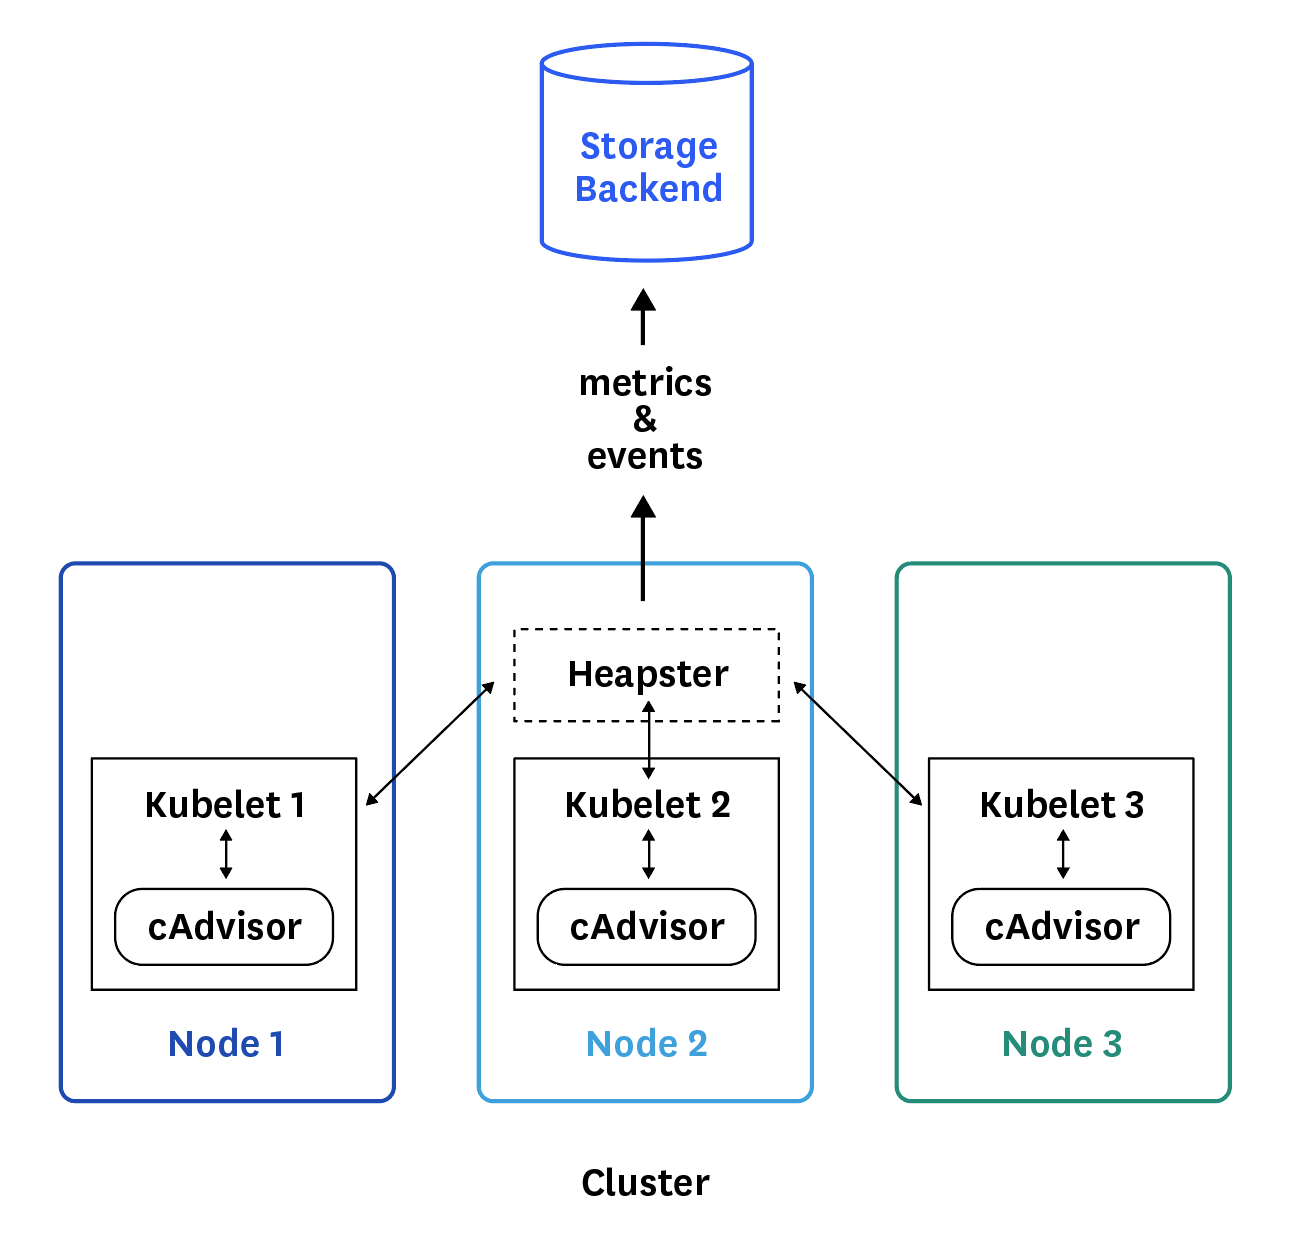
How Heapster works
Even if Heapster is designed to be able to collect data from multiple sources, the only source supported right now is Kubernetes (through cAdvisor). This has to be specified in the Heapster deployment specs after the /heapster command with the flag
--source=kubernetes:<KUBERNETES_MASTER>[?<KUBERNETES_OPTIONS>] (see example deployment below).
Options are optional URL query parameters, separated by &, that can be used to set a custom configuration for each source without having to add new flags to Heapster for each source. Although Kubernetes is the only enabled source type currently, you can have multiple sources if you want to collect metrics from several Kubernetes clusters.
You need to securely connect Heapster to the Kubernetes API server using an authentication token, for which configuration steps are detailed here.
You can choose between different backends, also called sinks, to store the metrics exposed by Heapster. The backend you select has to be specified in the Heapster deployment specs after the /heapster command with a flag of the following format
--sink=backendname:<CONFIG>[?<OPTIONS>] (see example deployment below).
As with metric sources, options are optional URL query parameters separated by &. These parameters allow you to set custom configuration options for each sink.
Heapster is set up to use InfluxDB as storage backend by default, but you will find here the list of all the current sink types supported by Heapster, including Kafka and Elasticsearch, and how to configure them.
You can store data in multiple sink types at the same time. You would need to use a separate --sink=... flag for each sink type, appending the options for all the sinks of that type.
To deploy Heapster you will need to create the Kubernetes resources described here depending on the backend you want to use.
For example with influxdb, here is the Heapster service definition:
apiVersion: v1

kind: Service

metadata:

  labels:

    task: monitoring

    # For use as a Cluster add-on (https://github.com/kubernetes/kubernetes/tree/master/cluster/addons)

    # If you are NOT using this as an addon, you should comment out this line.

    kubernetes.io/cluster-service: 'true'

    kubernetes.io/name: Heapster

  name: heapster

  namespace: kube-system

spec:

  ports:

  - port: 80

    targetPort: 8082

  selector:

    k8s-app: heapster
And here an example of a Heapster deployment definition:
apiVersion: extensions/v1beta1

kind: Deployment

metadata:

  name: heapster

  namespace: kube-system

spec:

  replicas: 1

  template:

    metadata:

      labels:

        task: monitoring

        k8s-app: heapster

        version: v6

    spec:

      containers:

      - name: heapster

        image: kubernetes/heapster:v1.3.10

        imagePullPolicy: Always

        command:

        - /heapster

        - --source=kubernetes:https://kubernetes.default

        - --sink=influxdb:http://monitoring-influxdb:8086
Your sink and graphing tool will require similar service and deployment definitions since they are running in pods.
kube-state-metrics is a service that provides additional metrics that Heapster does not. Heapster exposes metrics about the resource utilization of components such as CPU, memory, or network. kube-state-metrics, on the other hand, listens to the Kubernetes API and generates metrics about the state of Kubernetes logical objects: node status, node capacity (CPU and memory), number of desired/available/unavailable/updated replicas per deployment, pod status (e.g. waiting, running, ready), and so on.
Here are all the metrics available from kube-state-metrics, which works only with Kubernetes version 1.2 or later.
Note that the way it works under the hood is different from Heapster, which is only an intermediary that reformats and exposes metrics already generated by Kubernetes, whereas kube-state-metrics generates the metrics itself.
kube-state-metrics metrics can be collected from the kube-state-metrics API in plaintext or protobuf format. They can be ingested by a monitoring tool capable of parsing this data. Tools can also integrate with the Prometheus Go client and its HTTP endpoint.
kube-state-metrics can be deployed like a classic Kubernetes service with only one replica.
You can build the container image by running Make container from the kube-state-metrics root folder.
Then you can build and run it in a pod that has read-only access to your Kubernetes cluster. To create the necessary Kubernetes service and deployment, run kubectl apply -f kubernetes
Here is the service created:
apiVersion: v1

kind: Service

metadata:

  annotations:

    prometheus.io/scrape: 'true'

  name: kube-state-metrics

  labels:

    app: kube-state-metrics

spec:

  ports:

  - name: kube-state-metrics

    port: 8080

    protocol: TCP

  selector:

    app: kube-state-metrics
Note that the line prometheus.io/scrape: 'true' allows Prometheus or other parsing tool to collect kube-state-metrics metrics as soon as the deployment is done.
Some metrics specific to Kubernetes can be spot-checked via the command line. The most useful one is kubectl get which allows to display the status of different Kubernetes objects. For example, in order to monitor your pod deployments, you can see the number pods available, desired and currently running with this command:
$ kubectl get deployments
NAME               DESIRED   CURRENT   UP-TO-DATE   AVAILABLE   AGE
nginx-deployment   3         3         3            3           18s
Command line tools are nice for spot-checking but you often want to be able to track the evolution of these metrics over time. Fortunately some monitoring tools enable you to easily visualize this data and correlate it with other metrics such as resource utilization.
Once you have manually configured your metric collection and storage, you can connect a dashboarding interface such as Grafana (usually used in combination with InfluxDB for Heapster metrics) that will fetch and graph your monitoring data.
When working with Heapster metrics, your storage backend and data visualization application both need to run in pods that expose themselves as Kubernetes services; otherwise Heapster won’t be able to discover them.
As discussed in Parts 1 and 2, properly monitoring your orchestrated, containerized infrastructure requires you to combine metrics, events, and labels from Kubernetes, your container technology, the applications running in your containers, and even the underlying hosts.
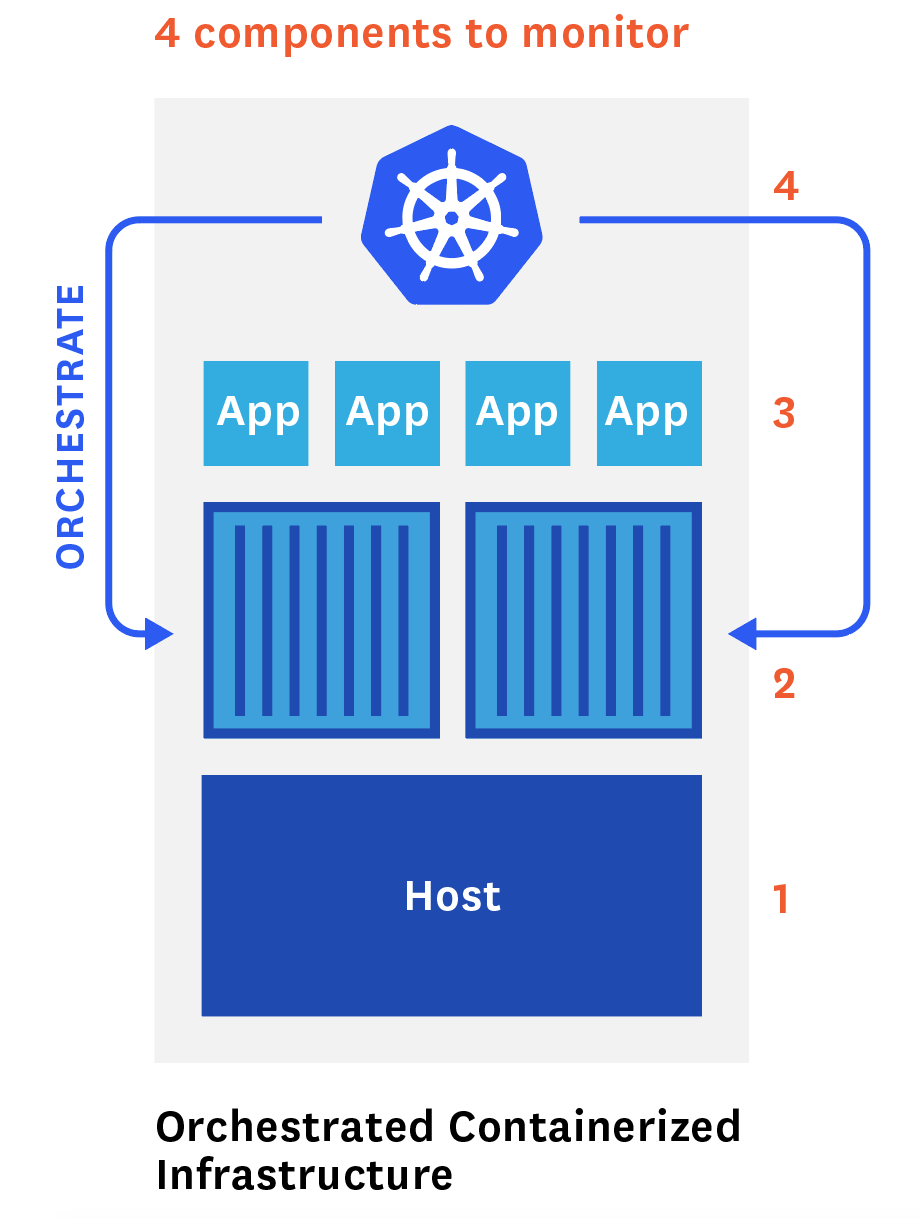
That’s why your visualization or monitoring tool needs to provide powerful correlation features, as well as the ability to collect metrics from all of these components. Below we’ll outline how to do it using native and open source tools.
If you have read Part 2 of this series, you know that you should favor the statistics natively collected from your container technology for resource metrics such as CPU usage in order to get around the uncertain collection interval used by Heapster for Kubernetes metrics. Note that Kubernetes applies labels to Docker metrics.
If you are using Docker, you will find details about the different mechanisms you can use to collect all the Docker metrics you need in our Docker monitoring guide.
Relying only on cAdvisor and Heapster to collect metrics from your containerized application is very limiting. Since Kubernetes 1.2, a new feature (still in alpha) does allow cAdvisor to collect custom metrics from applications running in containers, but only if these metrics are exposed by pods in the Prometheus format natively, which is the case for only a few applications today.
Some tools allow you to bypass the cAdvisor-Heapster combination and use Prometheus directly to collect and store metrics. The condition is that these metrics have to be exposed in the Prometheus format.
Since Kubernetes version 1.3, you now have the ability to distribute your Kubernetes clusters across different cloud providers. Note that this can complicate your monitoring, because even though storage backends such as InfluxDB allow you to store metrics from multiple clouds, Heapster does not currently offer any way to aggregate these data.
The first section of this post outlines how you can manually access performance data about your containerized infrastructure using built-in and open source tools. For production infrastructure, you will likely want a more comprehensive monitoring system that:
- Seamlessly integrates with Kubernetes, Docker, and all your containerized applications, so you can see all your metrics and events in one place
- Offers service discovery so you can seamlessly monitor your moving applications
- Can be setup and configured quickly
- Offers advanced monitoring features including powerful alerting, outlier and anomaly detection, dynamic aggregation using labels and tags, and correlation of metrics and events between systems
At Datadog, we have worked hard to solve the new challenges Kubernetes brings to monitoring, which were detailed in Part 1, including service discovery. Datadog automatically collects labels and tags from Kubernetes and Docker, and integrates with all the components that need to be monitored. Datadog aggregates all the metrics you need, including the ones mentioned in Part 2, even if your clusters are distributed across multiple data centers or cloud providers.
The next and last part of this series describes how to monitor your Kubernetes-orchestrated infrastructure using Datadog, and shows you how to set up the integrations you need in your own environment.