Object detection techniques are indispensable parts for autonomous driving. Accurately detecting the surrounding objects can help autonomous vehicles react and prevent potential collisions. In this project, we use convolutional neural network approaches to detect and classify objects using data from Waymo Open dataset, which provides rich and yet various driving scenes, will be used to train our neural network models. The dataset contains images of urban environments containing annotated cyclists, pedestrians and vehicles. First, we perform an extensive data analysis including the computation of label distributions, display of sample images, and checking for object occlusions. Then, We first analyze the data in Waymo Open dataset and split the data into training, validation and test sets based on the cross-validation method. Finally, we perform the training and further improve the model with different strategies.
This project will include use of the TensorFlow Object Detection API, where we can deploy our model to get predictions on images sent to the API.
The dataset is in tfrecord format that contains the images being resized to 640x640 and the bounding box information. Images are taken from different places in different weather conditions and at different time of the day (day/night).
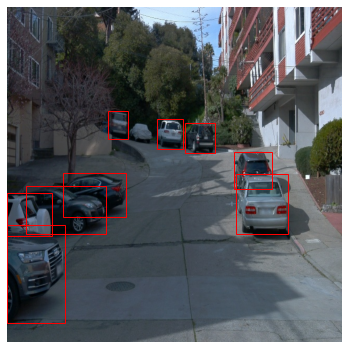
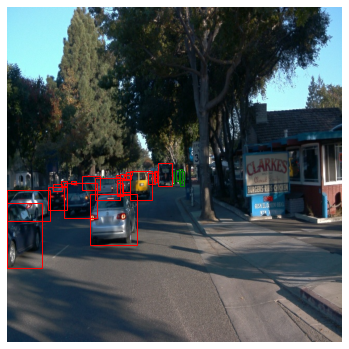
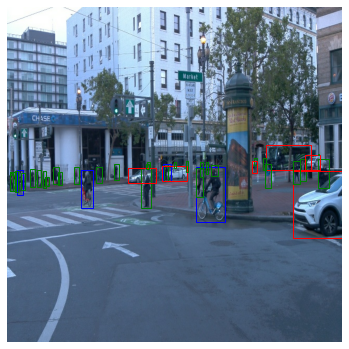
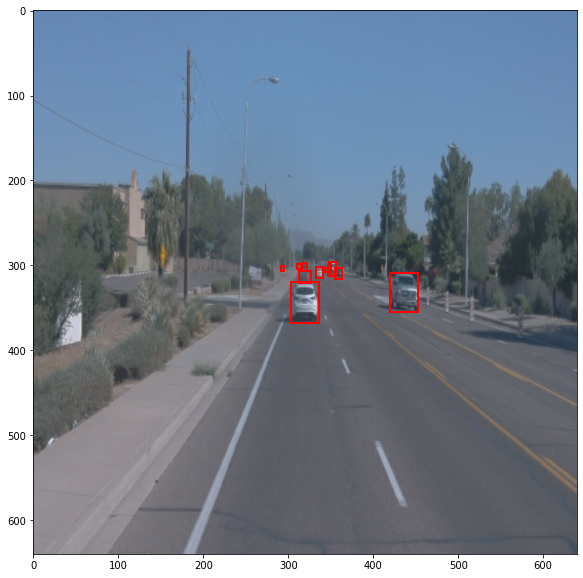
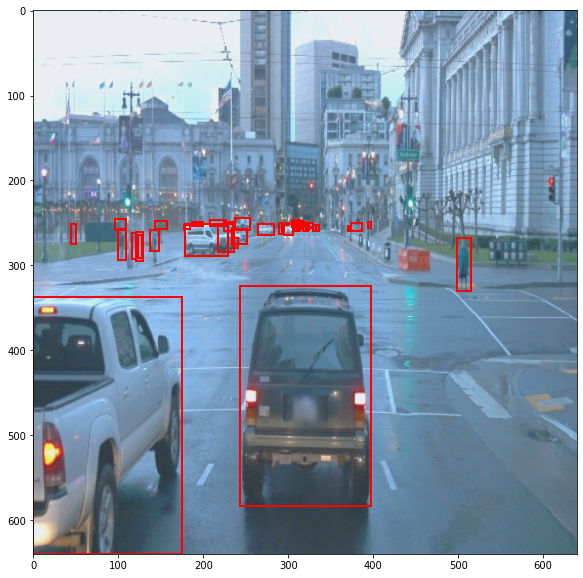
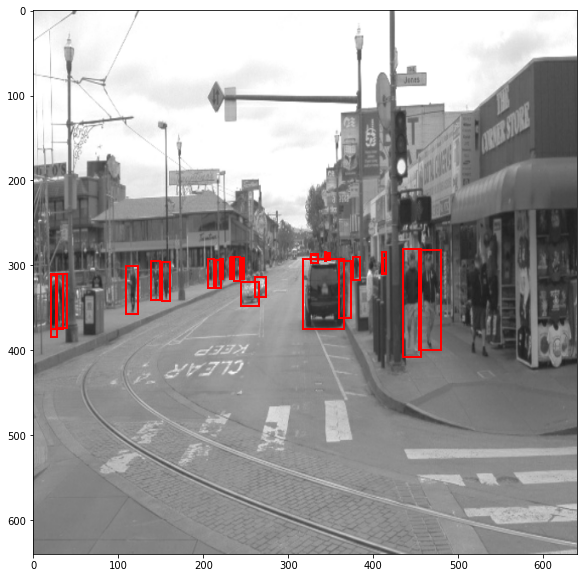
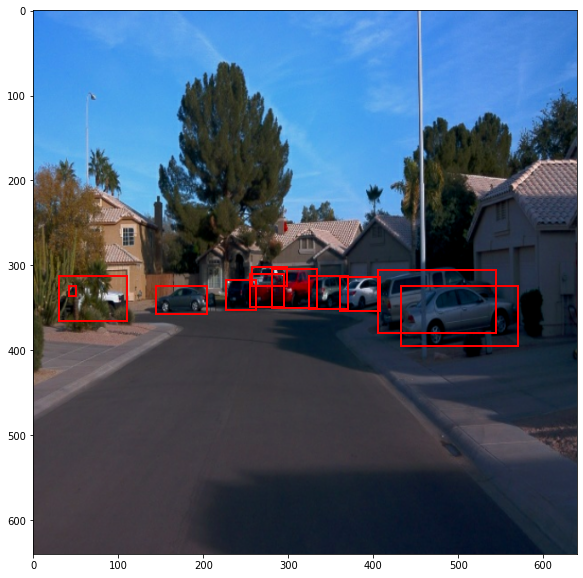
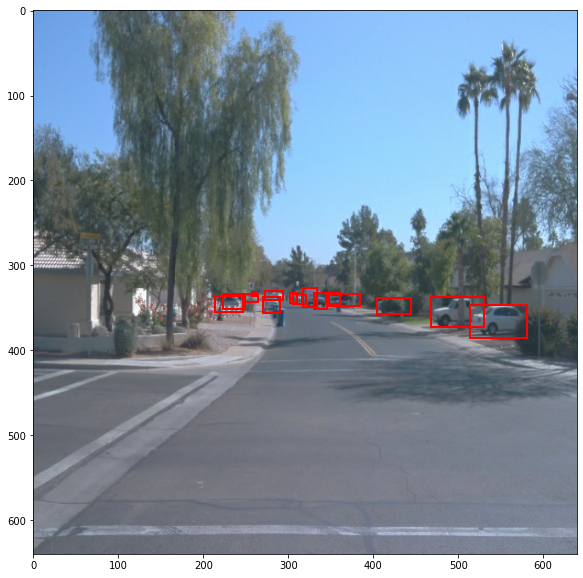
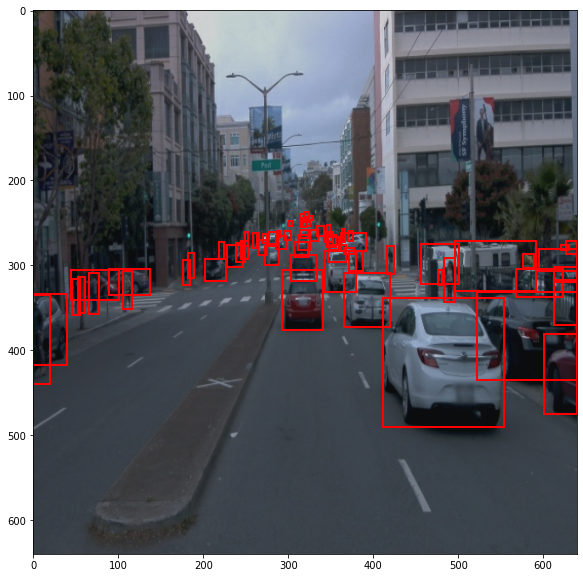
The image set contains diverse set of images of which some are blurry, clear, light and some are dark. The function of randomly displaying 10 images, as shown below, is implemented to check whether the image associated its corresponding bounding boxes and class labels are presented correctly.
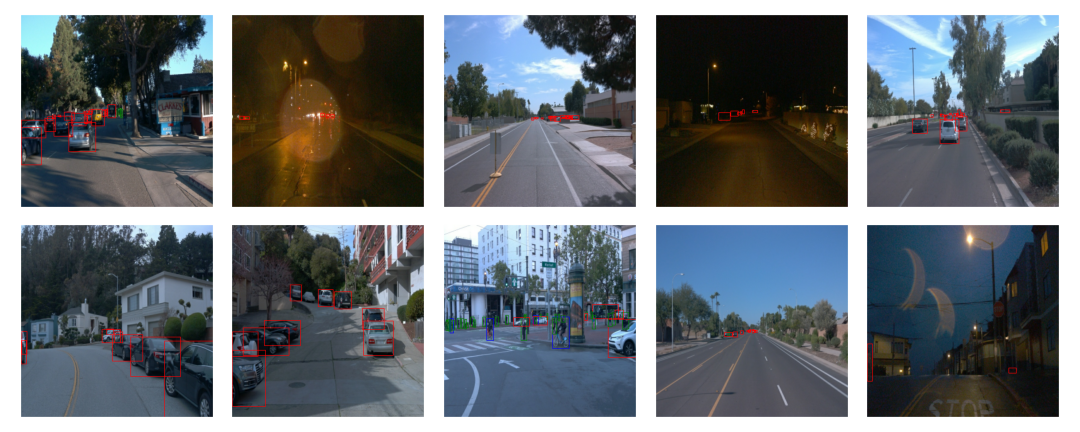
The bounding boxes are red for the vehicles, green for the cyclists and blue for the pedestrians.

We have taken 20000 images from dataset for analyzing:
-
Number of objects for each classs.
-
Number of bounding boxes.
-
Average brightness.
-
Number of images taken in different scenes (day/night).
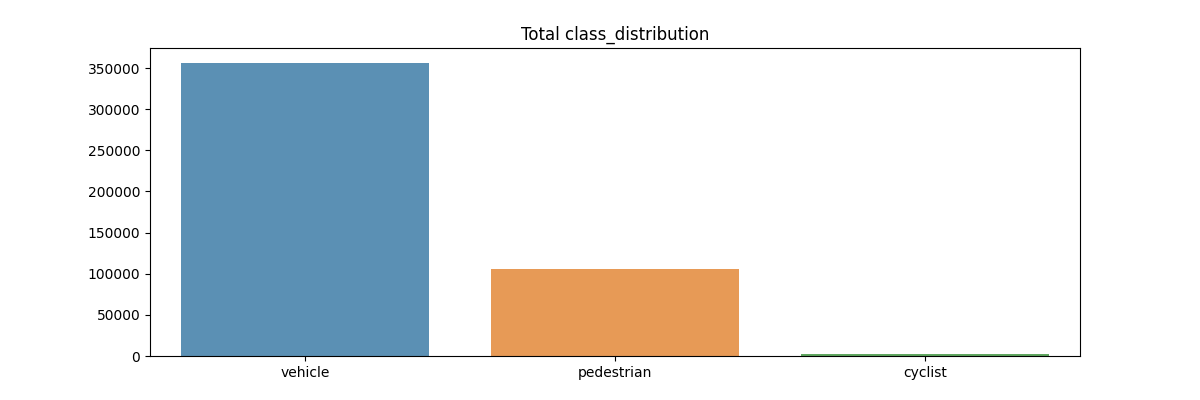
In the image shown below, we can see the number of
carare much more thanpedestrianandcyclist. The main reason might be the fact that most of images are taken from car driving not in downtown, Thus there are not many people actually appear in the scene. The number ofpedestrianandcyclistfor training a model may not be sufficient.
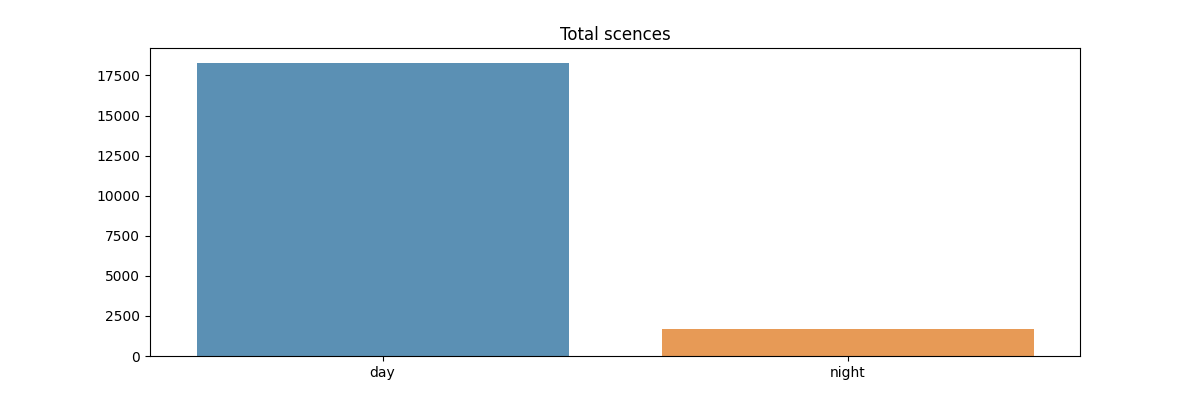
Now we look at the statistics of driving scenes for daytime/night. We calculate each pixels' average value over 3 channels(RGB)
np.sum(np.sum(img))/(640*640*3). If the average value is less than 50, we identify the image is taken at night. The results showed that the number of images taken in daytime is dominant, which make it more challenging for recognizing objects in the darker scenes.
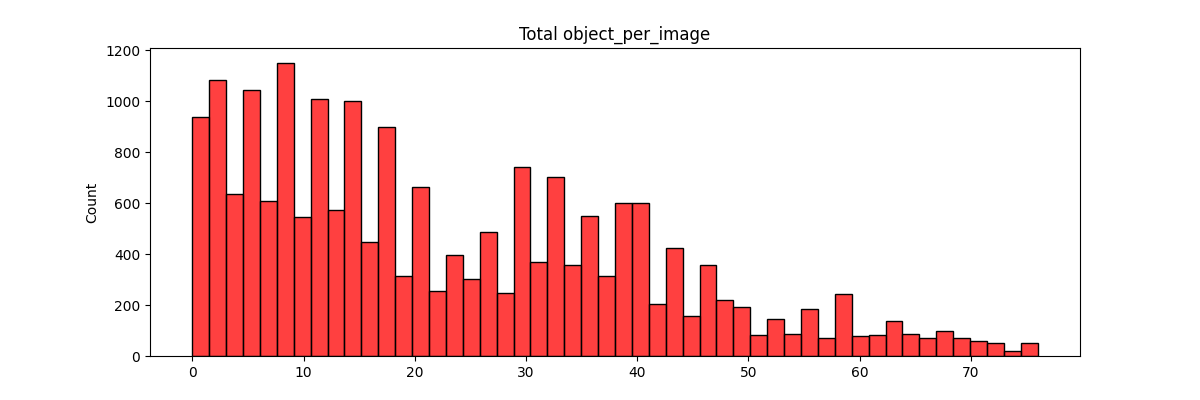
Next, we analyze the bounding box's total count and the distribution of the objects (bounding boxes) in images. As shown below, we can see that most of images are in 20 objects per image. It may imply that some of the objects are overlapped, which means only partial information is captured by the camera.
We have 100 tfrecords. Here we first shuffle data and then split the data into training, validation and test datasets. More specifically, 75% for training, 15% for validation and 10% for test. Each set has its own folder containing its corresponding images split from the processed Waymo open data. The reason behind shuffling before splitting is to reduce imbalanced data in each split and ensures that each dataset has approximately equal distribution of samples.
We will monitor the training with TensorBoard and decide when to end it. Finally, we will compare and extract different hyperparameters to improve our model's performance and select only most significant ones.
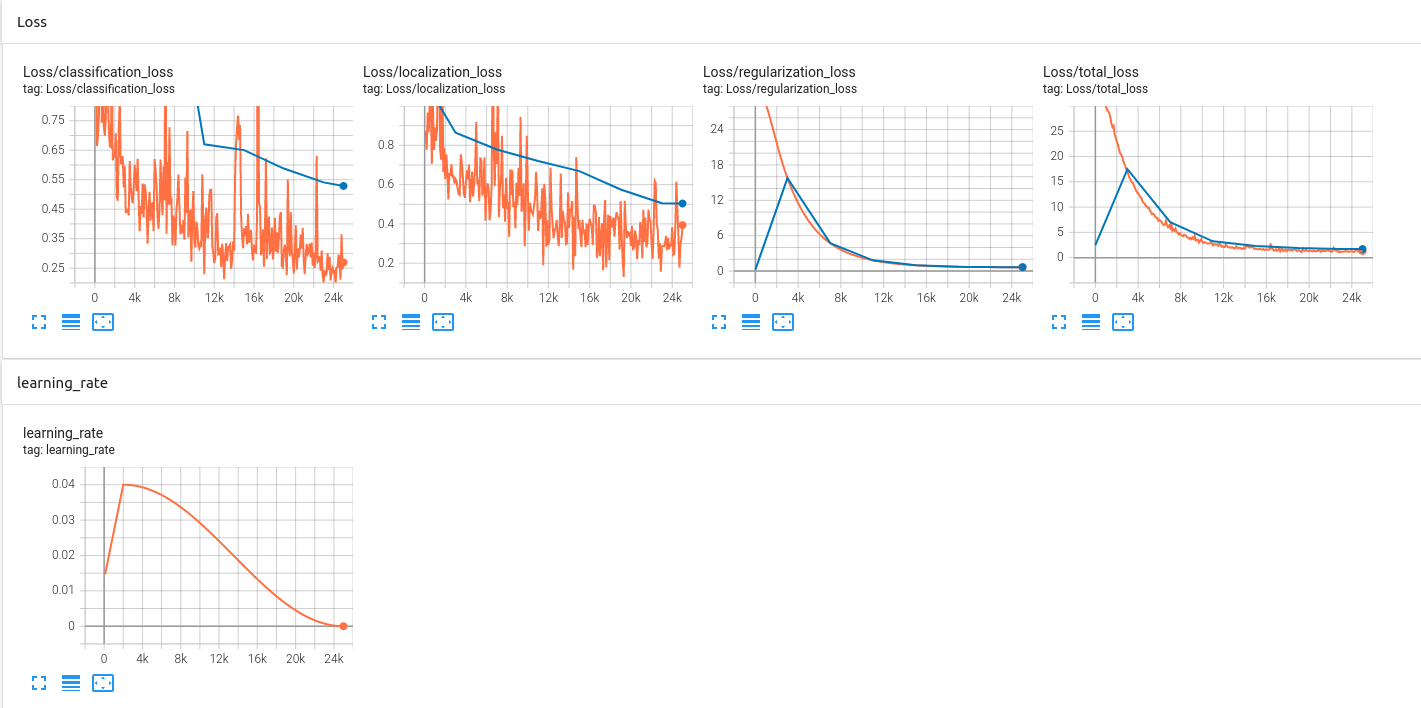
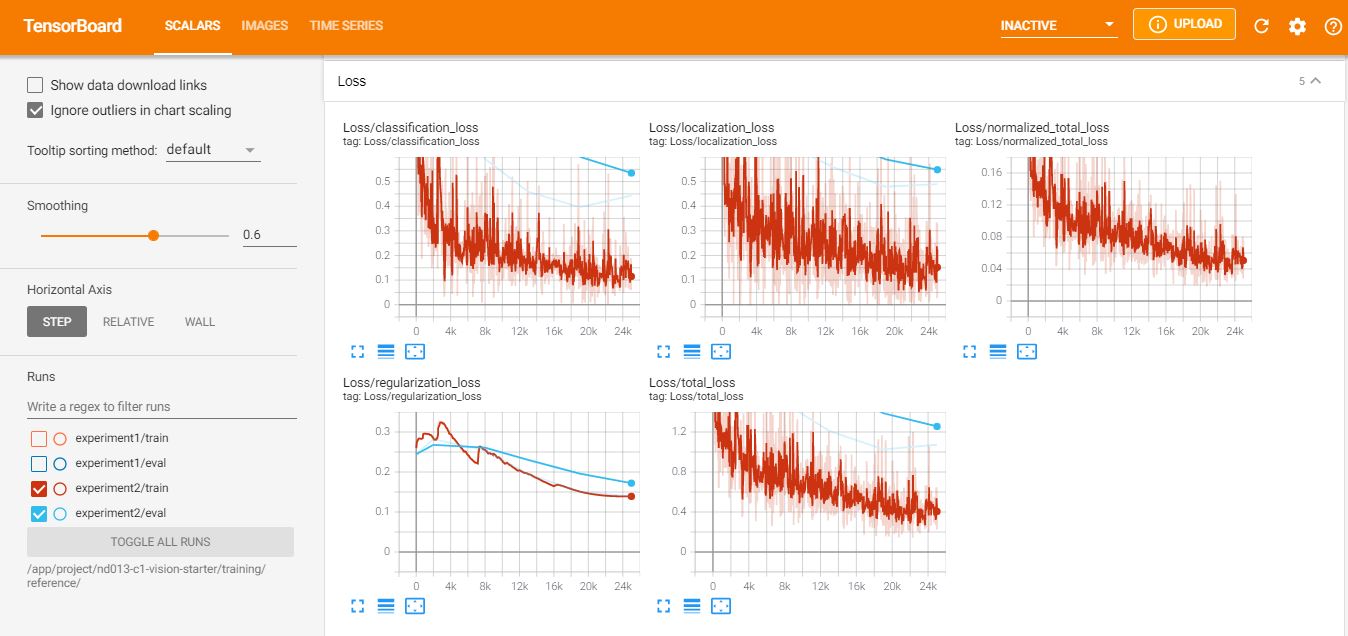
We perform the transfer learning using SSD_ResNet50 model with the default pipeline configuration. The results of Loss and DetectionBox_Recall/Precision will be served as baselines. The curve in orange is Loss in training steps and blue dot is Loss in evaluation. Total loss for training and validation sets appear to converge. On closer inspection the values are 1.24 and 1.70 for training and validation loss respectively. Therefore, the model is slightly overfitting the training data and the trained model needs to be more generous to predict objects in unseen data. To improve the initial results, we can add more variabilities in our data to simulate different environments during training. Hence, we will add more options of data augmentation in the pipeline configuration.
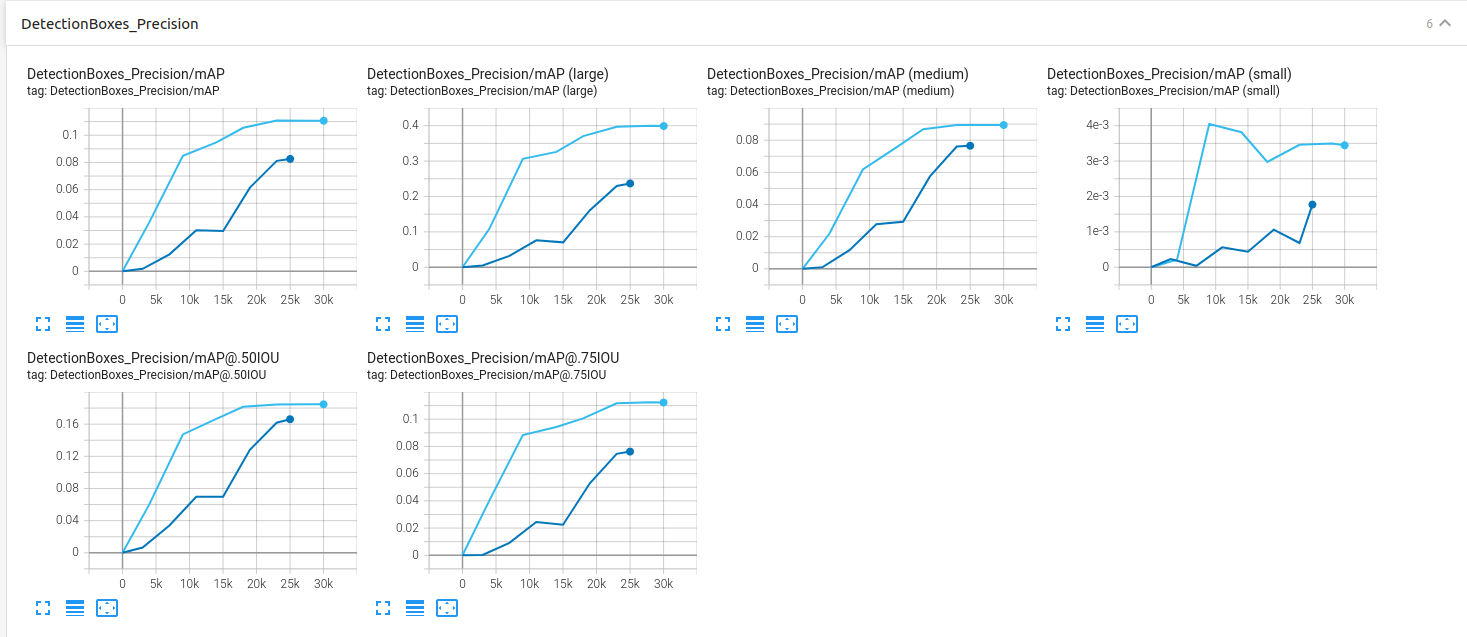
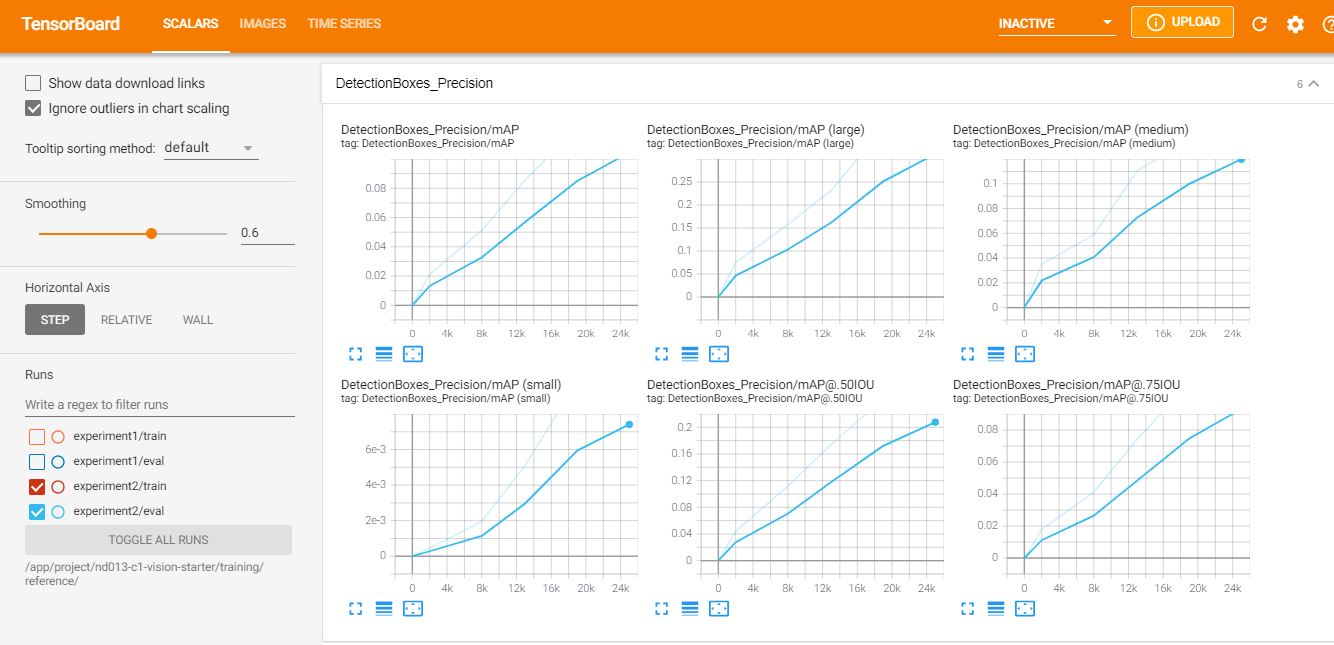
Detection Box precison:
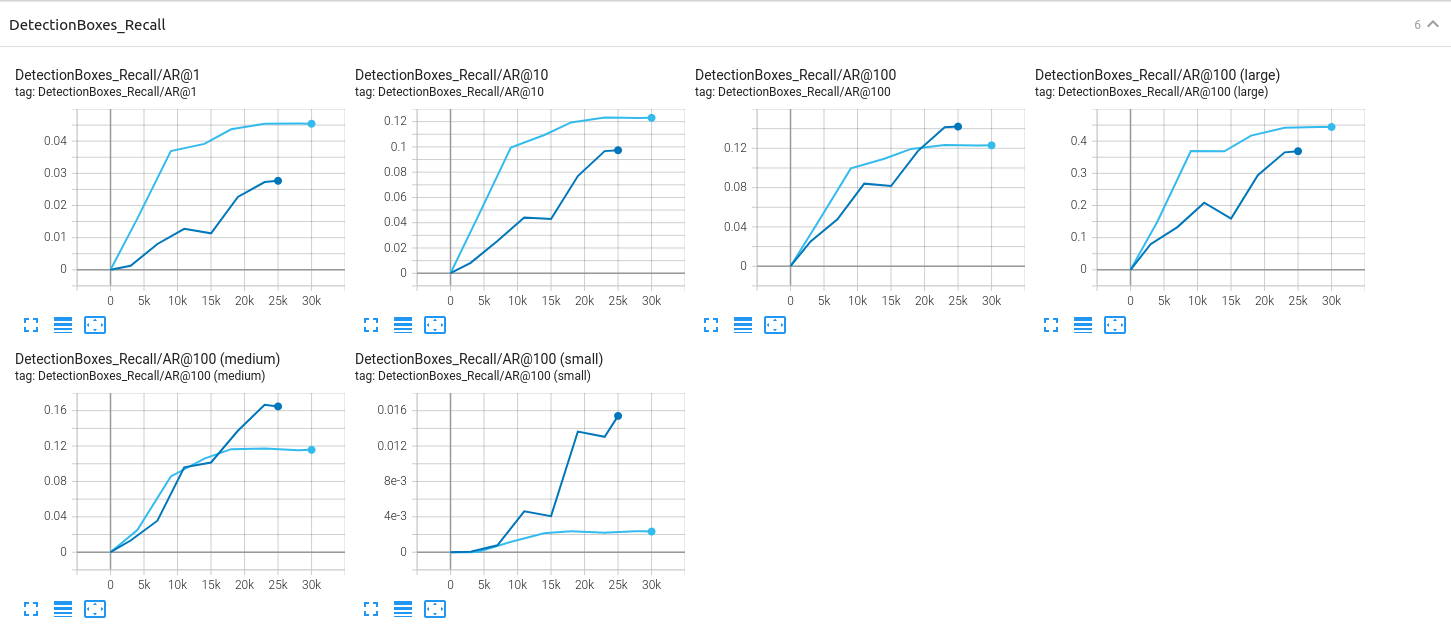
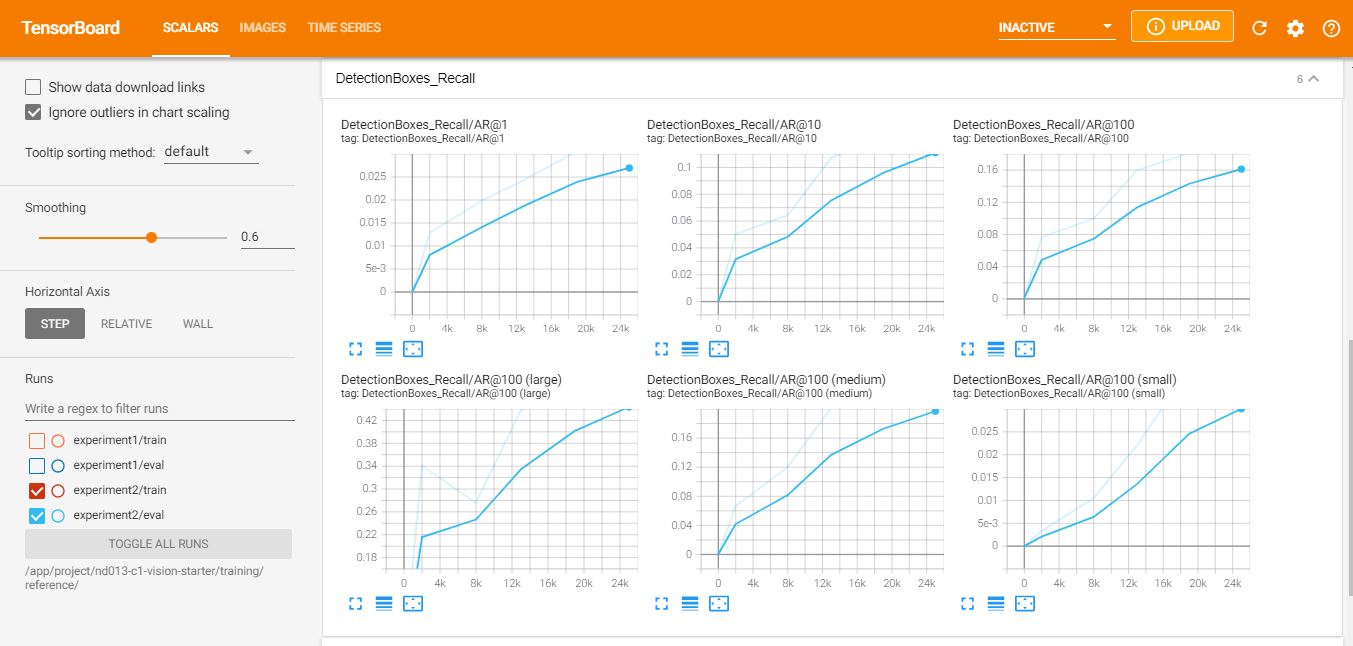
Detection Box Recall:
To improve on the model performance, we try several data augmentation steps such as gray-scale image conversion, random change contrast, saturation, brightness adjustments based on preprocessor.proto. Finally, The pipeline changes can be found in pipeline_new.config and the experiments with strategies of augmenting data are described in the next section. Augmentations applied:
-
0.02 probability of grayscale conversion
-
Brightness adjusted to 0.2
-
Contrast values set to
max_delta1.2 -
Saturation values between 0.8 and 1.25
 |
 |
 |
 |
 |
 |
The data augmentation operations done on images are added in data augmentation part in pipeline_config:
As shown in the figures below, the difference (0.16) of Classification Loss between training (0.14) and evaluation (0.30) is also better than the baseline. The evaluation metrics, Precision and Recall, also got improved.
Loss:
Detection Box precison:
Detection Box Recall:
There are still a huge room for model preformance. improvement, for example add more augmentated data, adjust more hyperparameter in pipeline_config. However, as shown above in data analysis, the class labels (pedestrian and cyclist) are very rare in the dataset. Thus, This is a critical requirement to add more images that contain those labels to have more balanced data and avoid biases which in return will improve accuracy.
After the trained model is exported, we perform object detection with the model on driving scenes stored in the test set.
The object detection results are shown in the video below:

The loss is lower than the previous loss (un-augmented model). This is an indication of better performance. We have reduced overfitting to an extent with augmentation, however better classification results would be resulting from a more balanced dataset.