-
Notifications
You must be signed in to change notification settings - Fork 1
/
team-stats-radar.Rmd
232 lines (197 loc) · 7.26 KB
/
team-stats-radar.Rmd
1
2
3
4
5
6
7
8
9
10
11
12
13
14
15
16
17
18
19
20
21
22
23
24
25
26
27
28
29
30
31
32
33
34
35
36
37
38
39
40
41
42
43
44
45
46
47
48
49
50
51
52
53
54
55
56
57
58
59
60
61
62
63
64
65
66
67
68
69
70
71
72
73
74
75
76
77
78
79
80
81
82
83
84
85
86
87
88
89
90
91
92
93
94
95
96
97
98
99
100
101
102
103
104
105
106
107
108
109
110
111
112
113
114
115
116
117
118
119
120
121
122
123
124
125
126
127
128
129
130
131
132
133
134
135
136
137
138
139
140
141
142
143
144
145
146
147
148
149
150
151
152
153
154
155
156
157
158
159
160
161
162
163
164
165
166
167
168
169
170
171
172
173
174
175
176
177
178
179
180
181
182
183
184
185
186
187
188
189
190
191
192
193
194
195
196
197
198
199
200
201
202
203
204
205
206
207
208
209
210
211
212
213
214
215
216
217
218
219
220
221
222
223
224
225
226
227
228
229
230
231
232
---
title: "Radar team stats"
author: "Flavio Leccese"
date: "`r Sys.Date()`"
output: html_document
---
```{r markdown-set, include=FALSE}
knitr::opts_chunk$set(
echo = TRUE,
message = FALSE,
warning = FALSE
)
invisible(Sys.setlocale(locale = "en_EN.UTF-8"))
library(devtools)
install_github("teunbrand/elementalist")
library(elementalist)
```
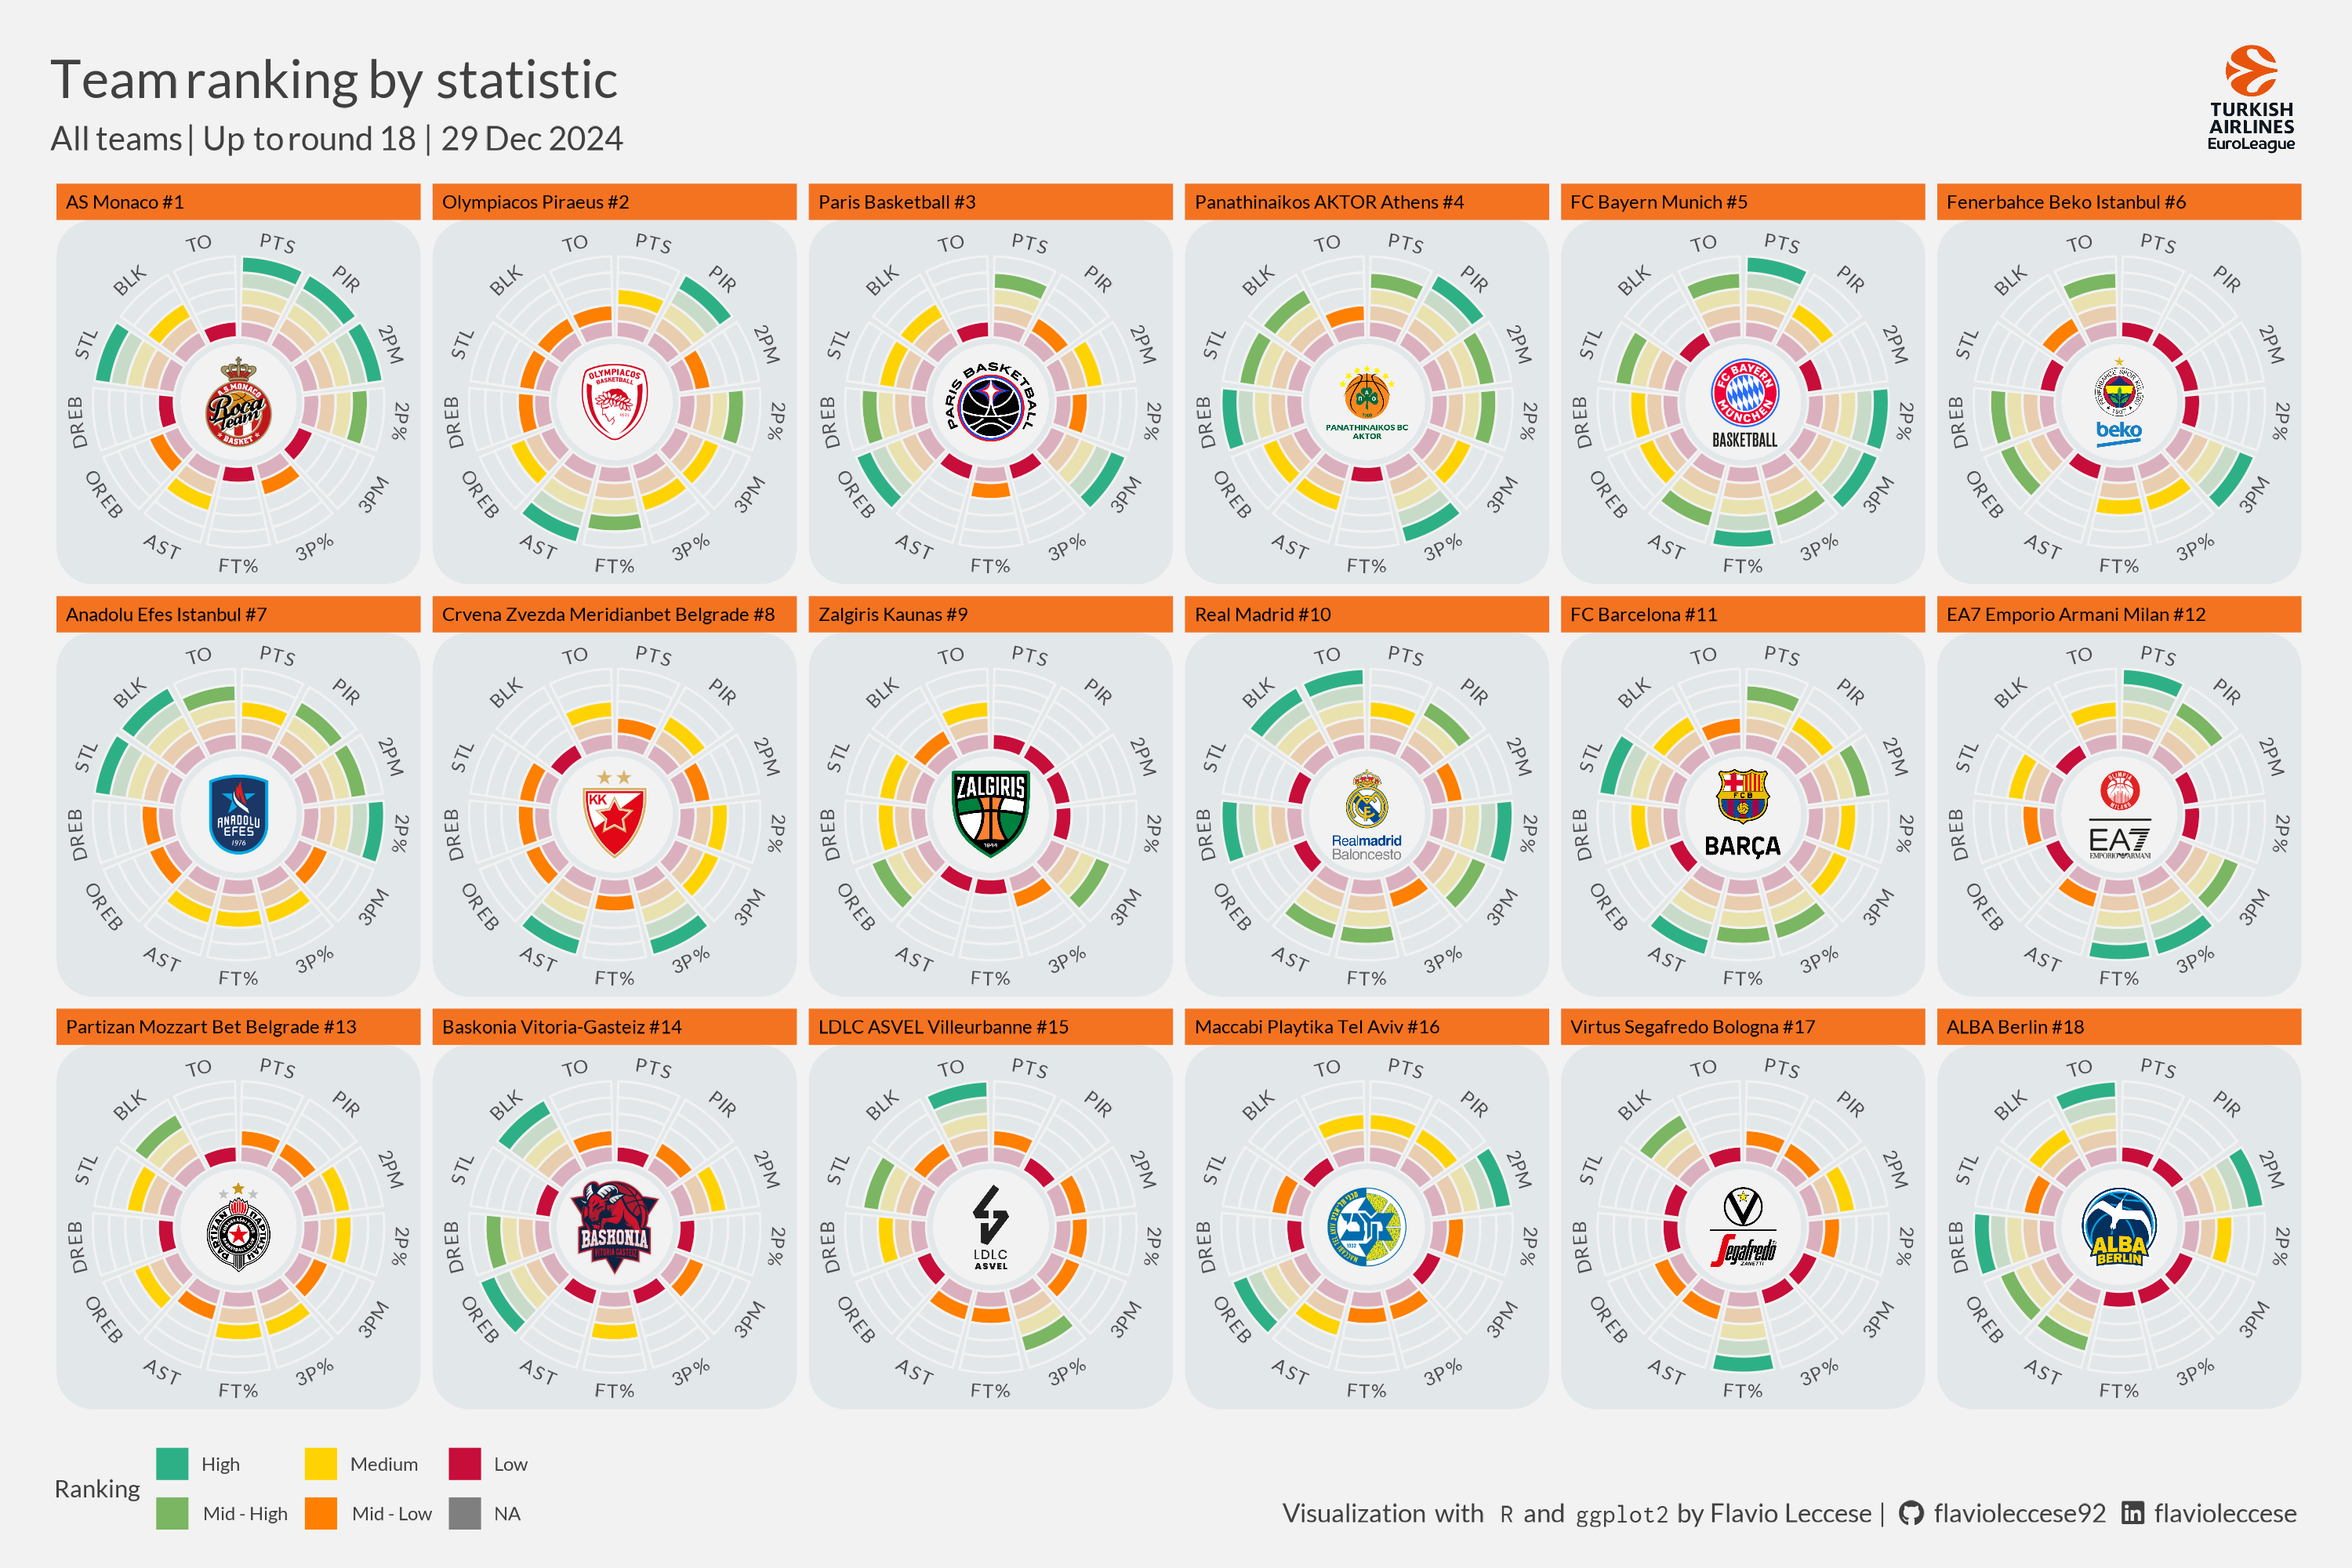
## Goal
We want to create a chart for each team showing the normalized ranking for
points (`PTS`), valuation (`PIR`), 2-points made (`2PM`), 2-points % (`2P%`),
3-points made (`3PM`), 3-points % (`3P%`), free-throws % (`FT%`), assists (`AST`),
offensive rebounds (`OREB`), defensive rebounds (`DREB`), steals (`STL`), blocks (`BLK`),
and turnover (`TO`).
Colours are ranging from
<span style="font-family:'Source Code Pro';background-color:#C70D3A;color:white;">#C70D3A</span>
to
<span style="font-family:'Source Code Pro';background-color:#2EB086;color:white;">#2EB086</span>.
Data can be obtained through `getTeamStats` function.
Resulted plot can be found at the bottom of this page.
## Setup
```{r setup}
library(euroleaguer)
library(tidyr)
library(dplyr)
library(ggplot2)
library(ggtext)
library(showtext)
library(ggimage)
library(glue)
library(geomtextpath)
library(hexbin)
# Add Lato font (Euroleague official font)
font_add_google("Lato", "Lato")
font_add_google("Inconsolata", "Inconsolata")
# Add Font Awesome for logos
font_add(family = "Font Awesome 6 Brands",
regular = "figures/fa-brands-400.ttf")
showtext_opts(dpi = 200)
showtext_auto()
```
## Data
```{r data}
CompetitionRounds <- getCompetitionRounds("E2023") %>%
filter(Sys.Date() >= MaxGameStartDate) %>%
slice_head(n = 1)
MaxRound <- max(CompetitionRounds$Round)
MaxGameDate <- format(as.Date(max(CompetitionRounds$MaxGameStartDate)),
'%d %b %Y')
CompetitionStandings <- getCompetitionStandings("E2023", CompetitionRounds$Round)
TeamStats <- getTeamStats("E2023", CompetitionStandings$TeamCode)
```
## Data for plot
```{r data for plot}
# Pick stats
stats <- c("PTS", "PIR", "2PM", "2P%", "3PM", "3P%", "FT%", "AST",
"OREB", "DREB", "STL", "BLK", "TO")
# Create dataset for stats
TeamStatsForPlot <- TeamStats$TeamAveragePerGame %>%
select(TeamCode, all_of(stats)) %>%
mutate(., across(all_of(stats), ~ ntile(., 5))) %>%
pivot_longer(cols = all_of(stats), names_to = "Stat", values_to = "Value") %>%
mutate(ActualValue = Value) %>%
group_by(TeamCode, Stat) %>%
complete(Value = -3:5) %>%
mutate(ActualValue = max(ActualValue, na.rm = TRUE)) %>%
ungroup() %>%
mutate(AlphaValue = case_when(
Value <= 0 ~ "Empty", Value == ActualValue ~ "Actual",
Value < ActualValue ~ "Less", TRUE ~ "Empty"),
FillValue = case_when(
Value == 5 ~ "High", Value == 4 ~ "Mid - High",
Value == 3 ~ "Medium", Value == 2 ~ "Mid - Low",
Value == 1 ~ "Low", TRUE ~ NA) %>%
factor(., levels = c("High", "Mid - High", "Medium", "Mid - Low", "Low")),
GroupValue = factor(Value, levels = 5:-3),
SizeValue = ifelse(Value <= 0, "Empty", "Colored")) %>%
left_join(CompetitionStandings %>%
select(TeamCode, TeamName, Position, TeamImagesCrest),
by = "TeamCode") %>%
arrange(Position) %>%
mutate(Team = glue("{TeamName} #{Position}")) %>%
mutate(Team = factor(Team, levels = unique(.$Team)),
Stat = factor(Stat, levels = stats))
```
## Image for plot
```{r images for plot}
TeamImage <- TeamStatsForPlot %>%
filter(!is.na(TeamImagesCrest)) %>%
distinct(Team, TeamImagesCrest) %>%
mutate(Stat = 4, y = 0)
```
## Title, subtitle and caption
```{r title, subtitle and caption}
PlotTitle <- glue(
"<span style = 'font-size: 32px'>Team ranking by statistic</span><br>
<span style = 'font-size: 20px'>All teams | Up to round {MaxRound} |
{MaxGameDate}</span>")
PlotSubtitle <- glue(
"<span><img src = 'figures/euroleague-logo-vertical.png'
height='50'></span>")
PlotCaption <- glue(
"<span>Visualization with </span>
<span style = 'font-family:\"Inconsolata\";'>R</span>
<span>and</span>
<span style = 'font-family:\"Inconsolata\";'>ggplot2</span>
<span>by Flavio Leccese |</span>
<span style = 'font-family:\"Font Awesome 6 Brands\";'></span>
<span>flavioleccese92</span>
<span style = 'font-family:\"Font Awesome 6 Brands\";'></span>
<span>flavioleccese</span>")
```
## Plot
```{r plot}
# Initialize
e <- ggplot(TeamStatsForPlot, aes(x = Stat))
# Draw background rectangles and Team image
e <- e +
geom_rect(xmin = -Inf, xmax = +Inf, ymin = 0, ymax = 0.4, fill = "#f2f2f2") +
geom_image(data = TeamImage, aes(y = y, image = TeamImagesCrest), size = 0.25,
image_fun = function(img) { magick::image_crop(img) }) +
geom_rect(xmin = -Inf, xmax = +Inf, ymin = 0.4, ymax = 1, fill = "#e2e7ea")
# Draw bars of stats
e <- e +
geom_bar(aes(y = 1, fill = FillValue, group = GroupValue,
alpha = AlphaValue, linewidth = SizeValue),
position = "fill", stat = "identity", colour = "#f2f2f2")
# Facet by team + general theme setting
e <- e +
facet_wrap(~ Team, ncol = 6) +
scale_x_discrete() +
coord_curvedpolar(
clip = "off") +
scale_alpha_manual(
values = c("Actual" = 1, "Less" = 0.25, "Empty" = 0), guide = "none") +
scale_linewidth_manual(
values = c("Empty" = 0, "Colored" = 0.5), guide = "none") +
scale_fill_manual(
name = "Ranking",
values = c("Low" = "#C70D3A", "Mid - Low" = "#FF7F00", "Medium" = "#FFD301",
"Mid - High" = "#7BB662", "High" = "#2EB086")) +
scale_hjust_manual(values = 0.8) +
theme(
# General
panel.grid.major = element_blank(),
panel.grid.minor = element_blank(),
panel.background = element_rect_round(fill = "#e2e7ea"),
plot.background = element_rect(fill = "#f2f2f2", colour = "transparent"),
plot.margin = margin(28, 15, 8, 15),
text = element_text(color = "#404040", family = "Lato"),
# Axis labels
axis.ticks = element_blank(),
axis.title.y = element_blank(),
axis.text.y = element_blank(),
axis.title.x = element_blank(),
axis.text.x = element_text(vjust = 0.5),
# Legend
legend.background = element_blank(),
legend.box.background = element_blank(),
legend.key = element_blank(),
legend.position = 'bottom',
legend.justification = 'left',
legend.direction = 'horizontal',
legend.margin = margin(10, 0, 3, 0),
legend.box.spacing = unit(0, "pt"),
# Title, subtitle, caption
plot.title = element_markdown(
lineheight = 1, size = 24, hjust = 0, vjust = 1, margin = margin(0, 0, -20, 0)),
plot.title.position = "plot",
plot.subtitle = element_markdown(
hjust = 1, margin = margin(-33, 3, -50, 0)),
plot.caption = element_markdown(
size = 12, margin = margin(-25, 0, 0, 3)),
plot.caption.position = "plot",
# Facets
strip.background = element_rect(fill = "#F47321"),
strip.text = element_text(colour = "black", hjust = 0)
) +
labs(title = PlotTitle, subtitle = PlotSubtitle, caption = PlotCaption,
x = "", y = "")
```
```{r save, include=FALSE}
# Save plot (standard width 4100)
ggsave("team-stats-radarchart.png", plot = e, path = "../../man/figures/",
height = 2000, width = 3000, units = "px", dpi = 200)
```
## Result