| title | description | author | tags | date_published |
|---|---|---|---|---|
Catchpoint data pipeline to Grafana |
Learn to ingest data from Catchpoint into Google Cloud for visualization and analysis with Grafana. |
drit |
telemetry, probes, monitors |
2021-04-20 |
Dritan Suljoti | Chief Product and Technology Officer | Catchpoint Systems, Inc.
Contributed by the Google Cloud community. Not official Google documentation.
Catchpoint’s digital experience monitoring platform provides an extensive fleet of network telemetry probes, as well as tools for capturing real user experience metrics, which give instant insight into the performance of networks, apps, and digital services. You can use Cloud Monitoring, in conjunction with the open-source analytics and interactive visualization web application Grafana, for all of your network performance monitoring and analysis.
This tutorial and its companion tutorial provide two methods of ingesting and visualizing data from Catchpoint within Google Cloud:
- This tutorial shows you how to deliver data to Grafana for visualization and analysis.
- The companion tutorial shows you how to set up a pipeline that ingests data captured by Catchpoint into Cloud Monitoring and use Metrics Explorer for visualization and analysis.
This tutorial uses Node.js, the Cloud Console, and gcloud commands on the Cloud SDK command line.
The fully configured data pipeline from Catchpoint to Grafana is illustrated in the following diagram:
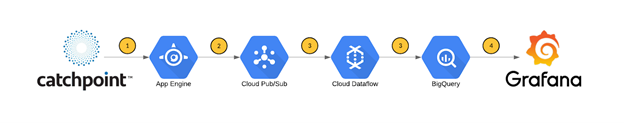
- Catchpoint posts data to an HTTP webhook set up in App Engine.
- App Engine publishes the data to a Pub/Sub channel.
- A Cloud Dataflow job listens to the Pub/Sub channel and inserts a BigQuery-accessible dataset.
- Data is sent to BigQuery along with the Catchpoint schema.
- Grafana's BigQuery plugin is used as a data source to visualize the data.
- Create a Pub/Sub Topic.
- Build a webhook in Google Cloud.
- Configure Catchpoint.
- Build your pipeline.
- Configure Grafana.
This tutorial uses billable components of Google Cloud, including the following:
Use the pricing calculator to generate a cost estimate based on your projected usage.
-
Create a new Google Cloud project or select an existing project.
For information about creating and selecting projects, see Creating and managing projects.
You need the Google Cloud project ID when you configure the Catchpoint script.
-
-
Main table:
{ "fields": [ { "mode": "NULLABLE", "name": "TestName", "type": "STRING" }, { "mode": "NULLABLE", "name": "TestURL", "type": "STRING" }, { "mode": "NULLABLE", "name": "TimeStamp", "type": "TIMESTAMP" }, { "mode": "NULLABLE", "name": "NodeName", "type": "STRING" }, { "mode": "NULLABLE", "name": "DNSTime", "type": "NUMERIC" }, { "mode": "NULLABLE", "name": "Connect", "type": "NUMERIC" }, { "mode": "NULLABLE", "name": "SSL", "type": "NUMERIC" }, { "mode": "NULLABLE", "name": "SendTime", "type": "NUMERIC" }, { "mode": "NULLABLE", "name": "WaitTime", "type": "NUMERIC" }, { "mode": "NULLABLE", "name": "Total", "type": "NUMERIC" } ] } -
Dead letter table:
{
  "fields": [
    {
      "mode": "NULLABLE",
      "name": "inputData",
      "type": "STRING"
    },
    {
      "mode": "NULLABLE",
      "name": "errorMessage",
      "type": "STRING"
    }
  ]
}
-
-
Deploy Grafana and the BigQuery Plugin for Grafana.
For details about deploying Grafana and adding the BigQuery plugin for Grafana, see the Grafana deployment guide and BigQuery Grafana plugin guide.
This section covers publishing and subscribing to a topic with the Cloud Console. You can also configure Pub/Sub using the gcloud command-line tool or the API.
For more information about these methods, see the gcloud documentation.
- Go to the Pub/Sub topics page in the Cloud Console.
- Click Create a Topic.
- Enter a unique topic name in the Topic ID field. This example uses
catchpoint-topic. - Click Save.
- Display the menu for the topic you just created, and click New Subscription.
- Enter a name for the subscription. This example uses
catchpoint-bq-dataset. - Leave the delivery type set to Pull.
- Click Create.
For more information about configuring Pub/Sub in the Cloud Console, see Quickstart: Using the Cloud Console.
A webhook (web application) provides a URL where vendors can post data to your application. The app listens on the defined URL and pushes posted data to the Pub/Sub topic created in the previous step.
-
Download the Go script in the Cloud Storage bucket here.
-
Edit the script and replace the
DefaultCloudProjectNamevalue with your project ID. -
If you chose a Pub/Sub topic name other than
catchpoint-topic, change theCatchpointTopicProdvalue to your chosen topic name.You may keep
/cppushas theCatchpointPushURLvalue or use another value of your choosing. After deploying the script, be sure to capture the entire webhook URL, which you need when configuring Catchpoint. -
Deploy the script on App Engine by following the App Engine deployment instructions.
-
Go to Catchpoint API Detail.
-
Select Add URL under Test Data Webhook.
-
Enter the entire URL for your webhook in the URL field.
-
Under Format either choose JSON to have Catchpoint send its default data payload in JSON format, or choose Template to customize the data payload.
If you chose Template, then do the following:
- Click Select Template.
- Click Add New.
- Enter a name for this template and select JSON as the format.
- Enter valid JSON specifying the format of the payload that will be posted to the webhook. Each value in the template is set using a macro, which will be replaced with actual data at run time. See Test Data Webhook Macros for all available options.
Here is a sample JSON template containing recommended macros:
{ "TestName": "${TestName}", "TestURL": "${testurl}", "TimeStamp": "${timestamp}", "NodeName": "${nodeName}", "PacketLoss": "${pingpacketlosspct}", "RTTAvg": "${pingroundtriptimeavg}", "DNSTime": "${timingdns}", "Connect": "${timingconnect}", "SSL": "${timingssl}", "SendTime": "${timingsend}", "WaitTime": "${timingwait}", "Total": "${timingtotal}" } -
Click Save at the bottom of the page.
For more information about configuring Catchpoint, see the Catchpoint webhook document.
-
Clone the data loader repository.
-
Change the
metric.javafile to match Catchpoint’s test data schema. You can download a readymetric.javafile from this Cloud Storage bucket. -
Switch to Java 8 in Cloud Shell:
sudo update-java-alternatives \ -s java-1.8.0-openjdk-amd64 && \ export JAVA_HOME=/usr/lib/jvm/java-8-openjdk-amd64/jre -
Build the uber JAR file (the JAR file with dependencies) by running the following command in the project root directory:
./gradlew clean && ./gradlew shadowJar -
Replace the placeholders in the following command with values for your environment, and then run the command in the project root directory:
cd build/libs && java -jar perf-data-loader-1.0.jar \
  --dataSet=[TARGET_DATASET] \
  --table=[TARGET_TABLE] \
  --deadLetterDataSet=[DEAD_LETTER_DATASET] \
  --deadLetterTable=[DEAD_LETTER_TABLE] \
  --runner=DataflowRunner \
  --project=[GOOGLE_CLOUD_PROJECT_NAME] \
  --subscription=projects/[GOOGLE_CLOUD_PROJECT_NAME]/subscriptions/[PUBSUB_SUBSCRIPTION] \
  --jobName=[PIPELINE_JOB_NAME]
If you need to update or change the pipeline, run the command with updated values and include
--updateas an additional argument.
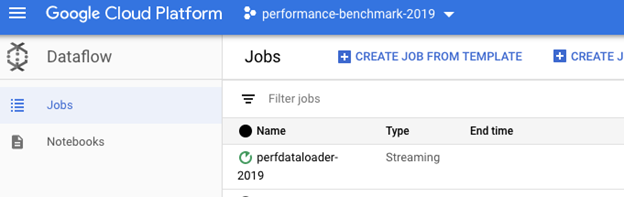
If the job deployed successfully, then you should see it listed in the Jobs view:
At this point, your data pipeline configuration is complete. Data posted to the webhook by Catchpoint should be propagating to your BigQuery tables and available for visualization in Grafana. For details, see the Grafana documentation.
To avoid incurring charges to your Google Cloud account for the resources used in this tutorial, you can delete the project:
- In the Cloud Console, go to the Projects page.
- In the project list, select the project that you want to delete and click Delete.
- In the dialog, type the project ID, and then click Shut down to delete the project.