Support to other debuggers (x64dbg, Windbg) on debugger mode #89
Comments
|
Hello,
Both of them.
Yes, exactly. The thing is that the $context is a physical address (Not a virtual address). So, the offset part (the low-value bits) is the same as the virtual address. By the way, I'll add a function to convert physical address to virtual address to script engine to make it convenient for use. (Thanks for feedback)
I'm not sure if I get the point but each time an event is triggered the $context is valid for the script of that special event. For example, you use
I'll fix it.
You should use $context and as I mentioned, I'll add a physical to the virtual address conversion function to make it more convenient.
I didn't get the point. You can use !monitor on kernel and user address. It's a hypervisor mechanism, it doesn't care about being kernel or user. It can monitor both a user and a kernel address.
As I said, depending on the event that is triggered.
Generally, there shouldn't be any problem. However, some of the events like trapping, stepping, and breakpoints are received by HyperDbg as it's a hypervisor and as we handle it earlier than x64dbg, user-mode debugger (or even kernel-mode debuggers) won't be notified. It can be solved by reinjecting events. However, we didn't go through that yet. so, that might be some incompatibility issues with other debuggers.
Of course, Discussions are a better place for questions as people might search and find answers to their questions more easily but if issues are more convenient for you, that's also okay. Thanks again for reporting these issues and feedbacks. I'll fix it soon and keep you updated. |
|
Thanks a lot for explanations, Sina! Let's assume that a process reads KUSER_SHARED_DATA + 0x10; !monitor r 0x7ffe0000 0x7ffe0fff script { printf("RIP=%llx,PID=%d,KUSER_SHARED_DATA read offset=%X\n",$ip,$pid,...................); } |
|
Yes of course, I'll add physical to virtual address functions soon. Also, are you sure about this?
I re-test it and it seems to be correct to me. Are you sure that you're using the latest version? |

|
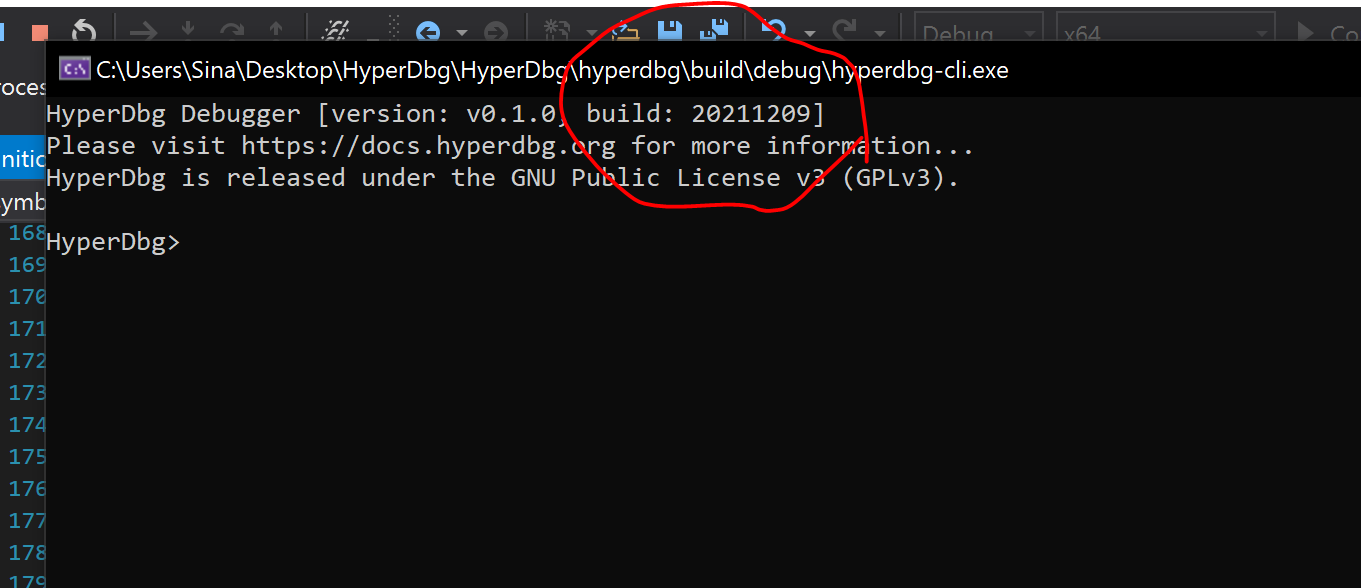
Yes , I am 100% sure I use latest git, I pulled origin last night. OK , tested some more, I realize now the issue, The issues I reported aren't manifesting themselves under a "normal" usage of HyperDbg. But if you try to use HyperDbg !monitor command while some process is opened by x64dbg (even if you specify "pid" parameter in !monitor or not)-> hell breaks loose, with all kind of heisenbugs appearing(like the ones that I reported above). Once again , if no process is in debug mode , it seems to work fine. This needs more testing , I will get back to you. Maybe this issue should be renamed "Process debugging incompatible with hyperdbg" or something like this. I also suggest adding hyperdbg version(something like 0.1.0-20211209) on top bar of hyperdbg-cli window. MEMORY.DMP : https://mega.nz/file/motWVA5K#tSejDimzb5vRCm6bFdfeehGE8Qe7LPvI0LqebSAIdMY Thanks |
Yeah, that's a great idea and it's now added (63d14d9). Here's the result: Thanks for the suggestion. |
Yes, but I suggest working on supporting other debuggers should be postponed to future versions, not for the first release. As it might break the HyperDbg semantics. We should keep it open until we solve this problem and make HyperDbg compatible with other debuggers. |
|
Thanks to your feedback, another fundamental problem comes to my mind. |
|
Привет |
|
HyperDbg now fully supports the concurrent use of other debuggers such as x64dbg and windbg when HyperDbg is loaded. https://docs.hyperdbg.org/commands/debugging-commands/test To use it, you need to disable breakpoint (#BP) and debug break (#DB) interception of HyperDbg by using the following commands: To test it, you need to either compile the 'master' branch or use GitHub Artifacts of the 'master' branch. |
Hello Sina
I am trying to trace memory reads from a process to KUSER_SHARED_DATA :
char * KUSER = (char*)0x7ffe0000;
When I try something like this, without specifying pid , I can clear events with "events c all" and set same events later.
!monitor r 0xfffff78000000000 0xfffff78000000FFF script { printf("RIP=%llx,PID=%d\n",$ip,$pid); }
!monitor r 0x7ffe0000 0x7ffe0fff script { printf("RIP=%llx,PID=%d\n",$ip,$pid); }
But when I try specifiying the pid in the above commands and doing "events c all" , I cannot set later same events,error is like in screenshot below.("page modifications is not applied,make sure you dont put multiple EPT hooks on same page...")
After that , I can unload the vmm but I cannot load vmm again , hyperdbg gets stuck and a restart is needed.
Either way(with pid or without) , it seems I am unable to trace KUSER reads from my little C++ unit test.
Are you kind enough to enlight me on the correct way to trace process reads from KUSER?(!monitor address range should be kernel space ones or process space ones?) I would like to know how can I find out the memory read address when I specify in !monitor a address range.Is this taken from $context? How do I know how $context looks depending on event?
Another issue: Doing !monitor pid with invalid pid triggers "err,invalid address (c0000005)", I think this is kinda confusing , what about "process pid= doesn't exist!" ?
For now I have few questions, if you have time to answer:
Thanks a lot
The text was updated successfully, but these errors were encountered: