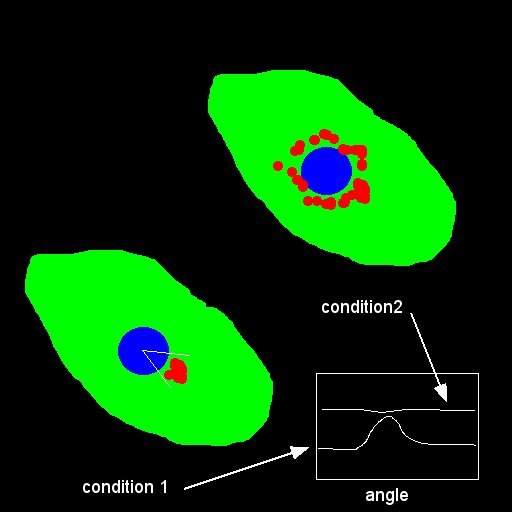
- Binarize your labelling (nucleus and endosomes) and find the centroids :
- Calculate the distance between centroids and normalize this distance by (feret/2): the value will be between 0 and 1.
- Transform your image in polar image with the plugin polar_transformer.class inside the macro :

- Calculate the profile in intensity (number of white pixel in the radial image in Y) versus angle
- Use Lowess function to remove high peak (smoothing)
- Normalize your profile in X (shift the max intensity to 0 (angle) and from -180 to 180) and Intensity by the sum to obtain probability
- Make the mean per condition and display the mean curves overlay per condition

- Calculate the standard deviation for each condition to quantify the dispersion in angle among the mean. As non polarized curved do not go to 0 (offset), the std of these curves should be higher
- Bin your profile data by 30 degrees to smooth the curves (the peak maximum is originally too high due to high local maximum value)
- Fit the curves with a Gaussian to determine the Y0 per condition (angle = 180 degrees) to obtain a quantification of polarisation from these curves (If the offset is low, the polarisation is high).