Visualizations in the DEA can be build through any module that results in html-embeddable plots.
This could just be generated matplotlib file::myplot.png files, or it could be fancy interactive visualizations. The default implementation uses`bokeh`_ for beautiful and customizable plots like this:

(Image borrowed from the bokeh project site)
There are two places where visualizations can be added to the DEA, to add visualizations on cohort level, reference the :meth:`dea.app.overview` route, which passes the plot created in :meth:`dea.app.plot_cohort_hist`.

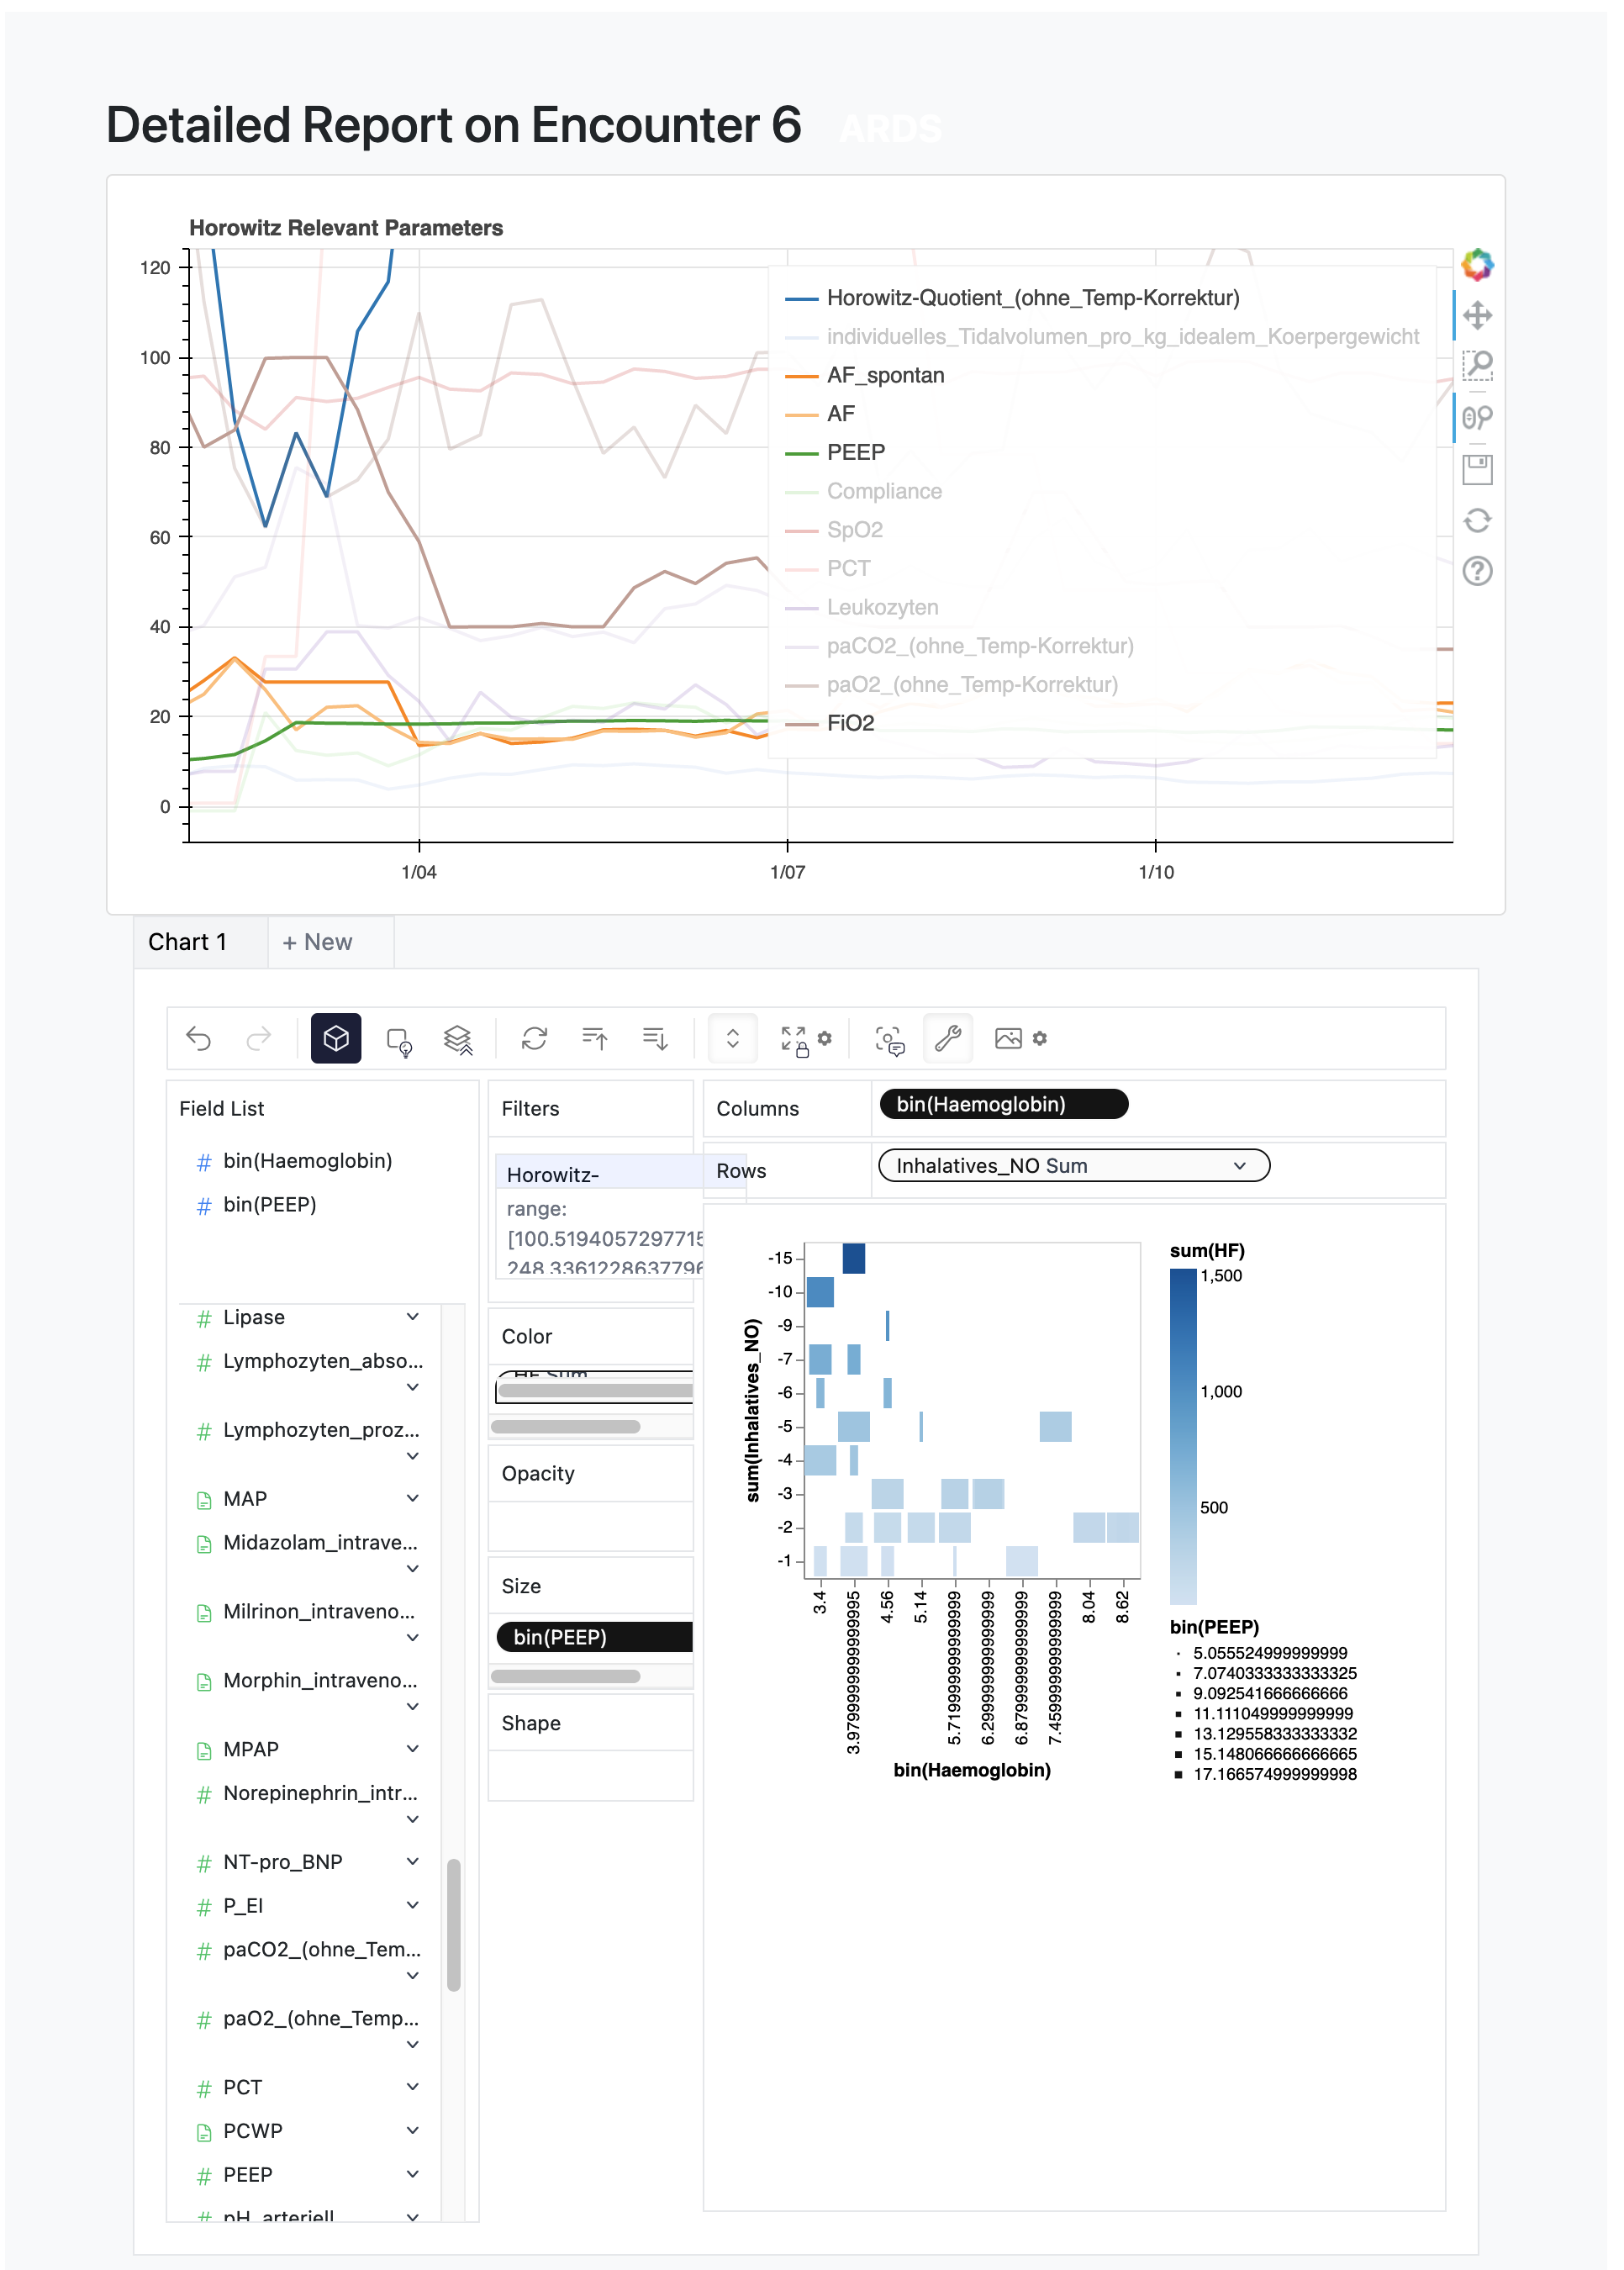
To add visualizations on the encounter level, reference the :meth:`dea.app.route_encounter` route, which creates the plot inline and also shows the pygwalker integration.
X = df.index
features = df.columns
p = figure(
    title="Example Plot",
    sizing_mode="scale_width",
)
for y in features:
    p.line(
        X,
        e.loc[y],
        line_width=2,
        legend_label=y,
        color=Category20[len(features)][features.index(y)],
    )
p_html_str = file_html(p, CDN)
plots = [p_html_str]  # plots is a list of plots that will be displayed in the DEA