If you want to test the downloaded trained models on the test set, please set resume_path={you_checkpointspath.pkl} in the last line of the config file.
python tools/run_net.py --config-file=configs/s2anet_r50_fpn_1x_dota.py --task=testAnd you can run the following scripts to draw results on test set images, where the {save_dir} is the path to output the drawed images:
python tools/run_net.py --config-file=configs/s2anet_r50_fpn_1x_dota.py --task=vis_test --save_dir={save_dir}You can also visualize the ground truth annotations of different datasets, we take DOTA as an example:
# vis_gt.py
from jdet.utils.visualization import visualize_dota_ground_truth
visualize_dota_ground_truth({DOTA_PATH}+"/train", DOTA1_CLASSES, {save_dir}, style={style})
Where {DOTA_PATH} is the path of the origin DOTA dataset, {save_dir} is the path to output the drawed images and {style} defines the visualization styles.
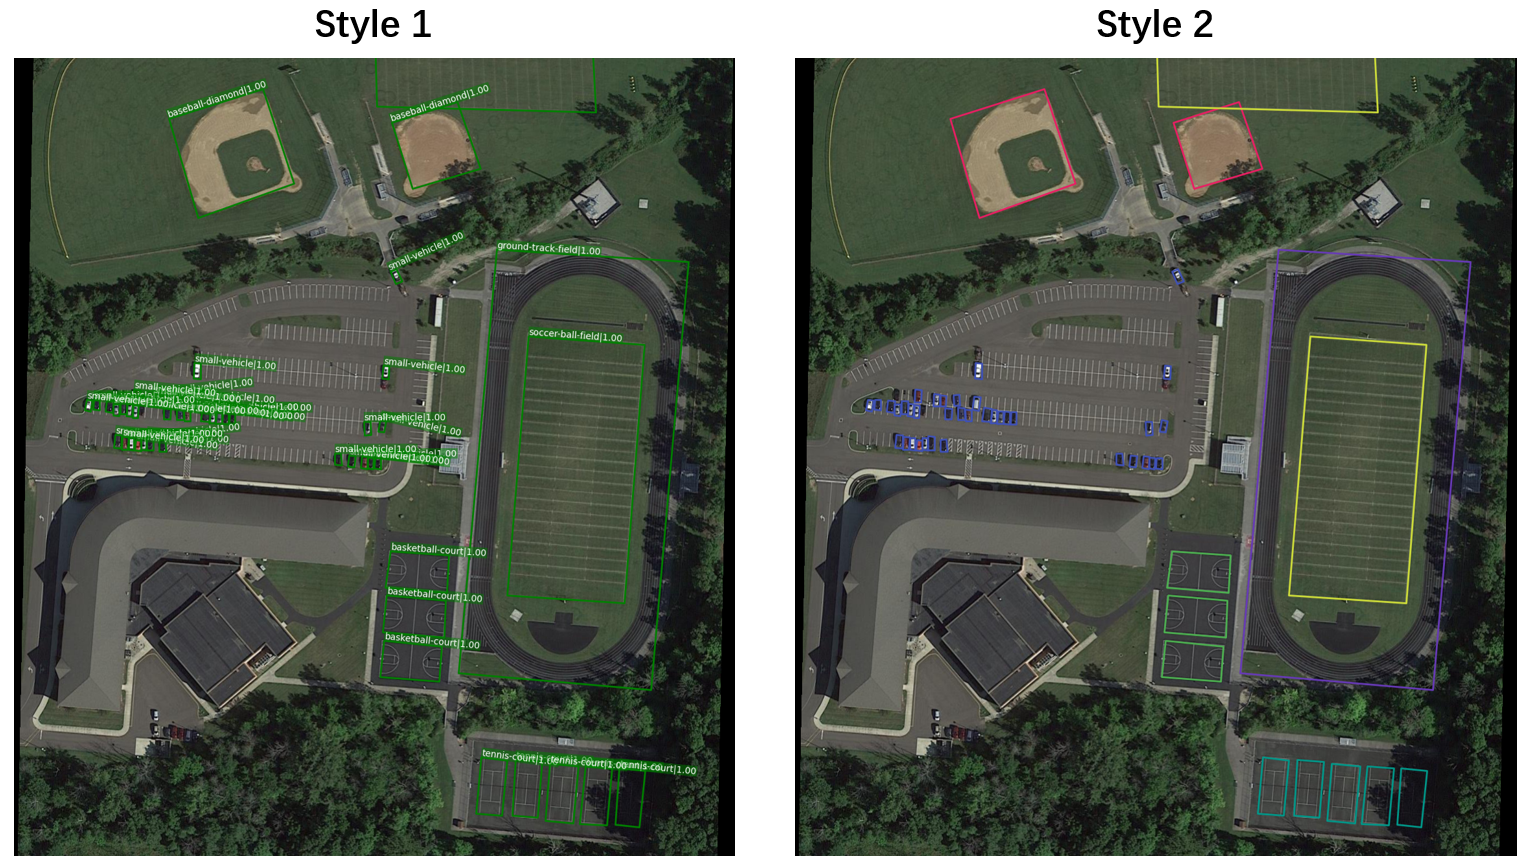 Note: different visualization styles can also be used in
 Visualization on images by change a few codes.
Image sizes of DOTA can usually reach several thousand, researchers usually crop an image into several sub-images and predict the results of each sub-image through the model, and finally merge the results of each sub-image to generate the final results.
This is an example of visualize the merged results:
# vis_dota.py
from jdet.utils.visualization import visualize_dota
visualize_dota({after_nms_path},{DOTA_PATH}+'/test/images',{save_dir})
Where {after_nms_path} is the results path contains baseball-diamond.txt, basketball-court.txt, etc.
You can also use jdet.utils.visualization.visualize_results or jdet.utils.draw.draw_bboxes to customize your own visualization. For the useage of the two functions, you can refer to :
python/jdet/visualization.py:visualize_dota_ground_truthpython/jdet/visualization.py:visualize_dotapython/jdet/runner/runner.py:Runner.run_on_images
# input
#     img: str|Var[h, w, 3], if img is str means it's a path of the img, or it's a np.ndarray img
#     bboxes[n, m]: n is the num of boxes, m is 4/5/8 means hbox(x1,y1,x2,y2)/rbox(cx,cy,w,h,a)/poly(x1,y1,x2,y2,x3,y3,x4,y4)
#     labels[n]: optional, values are int in [0, n_classes-1], n_classes is the num of classes
#     scores[n]: optional
#     class_names[n_classes]: optional, list of string, name of each class
#     score_thr: filter out boxes with score less than score_thr
#     colors
#     thickness
#     with_text
#     font_size
#     out_file: optional, string of output image path
# output
#     drawed_image
def draw_bboxes(img,
                  bboxes,
                  labels=None,
                  scores=None,
                  class_names=None,
                  score_thr=0,
                  colors='green',
                  thickness=1,
                  with_text=True,
                  font_size=10,
                  out_file=None):