Skip to content
New issue

Have a question about this project? Sign up for a free GitHub account to open an issue and contact its maintainers and the community.

By clicking “Sign up for GitHub”, you agree to our terms of service and privacy statement. We’ll occasionally send you account related emails.

Already on GitHub? Sign in to your account

edge_weights property for graphplot() #39

Open
kescobo opened this issue Oct 20, 2017 · 7 comments
Open

edge_weights property for graphplot() #39

kescobo opened this issue Oct 20, 2017 · 7 comments

Comments

@kescobo
Copy link

kescobo commented Oct 20, 2017

Would like to be able to do something like this:

using MetaGraphs
using PlotRecipes

g = MetaGraph(5)

add_edge!(g, 1,2)
add_edge!(g, 1,3)
add_edge!(g, 3,4)

set_prop!(g, Edge(1,2), :weight, 2.)
set_prop!(g, Edge(1,3), :weight, 3.)
set_prop!(g, Edge(3,4), :weight, 4.)

graphplot(g, edge_weights=([get_prop(g, e, :weight) for e in edges(g)], 0.5, :BrBG))

to set different sized lines for different edges. There's a node_weights property, so why not edge_weights?

@mkborregaard
Copy link
Member

You should in principle be able to do this with linewidth (which is a standard Plots keyword for the width of lines) but there seems to be something in the recipe that breaks it.

@mkborregaard
Copy link
Member

It's because linewidth doesn't accept a Vector. Solutions including adding that capability to Plots (might be possible using the same logic @daschw used to implement different colors for segments); or to make each edge it's own series here in GraphPlot.

@kescobo
Copy link
Author

kescobo commented Oct 21, 2017

@mkborregaard Can you point me to the PR for segment colors? I'll take a look and see if I can replicate.

@mkborregaard
Copy link
Member

It was this one JuliaPlots/Plots.jl#1110 which had to be supplemented with https://github.com/JuliaPlots/Plots.jl/pull/1142/files for GR as there were some unfortunate side effects. Not sure just replicating this will work, though.

I think implementing each edge as it's own series would work, though care must be taken not to screw up the line_z functionality. It's not an easy thing to do :-)

@kescobo
Copy link
Author

kescobo commented Oct 23, 2017

Oh - I thought you meant that a color/line segment had been implemented for graphplot specifically... this is something else. I'll take a look and see what makes sense. Could it be that adding some separate logic for graph plots while disabling stuff like line_z makes sense?

@mkborregaard
Copy link
Member

It might be but the philosophy of Plots is to generally mostly use the existing keywords so you don't have to learn bespoke keywords for each use.

@JackDevine
Copy link
Member

Digging up a slightly old issue here.

The desired functionality exsists:

using MetaGraphs
using LightGraphs
using GraphRecipes
using Plots

g = MetaGraph(5)

add_edge!(g, 1,2)
add_edge!(g, 1,3)
add_edge!(g, 3,4)

set_prop!(g, Edge(1,2), :weight, 2.)
set_prop!(g, Edge(1,3), :weight, 3.)
set_prop!(g, Edge(3,4), :weight, 4.)

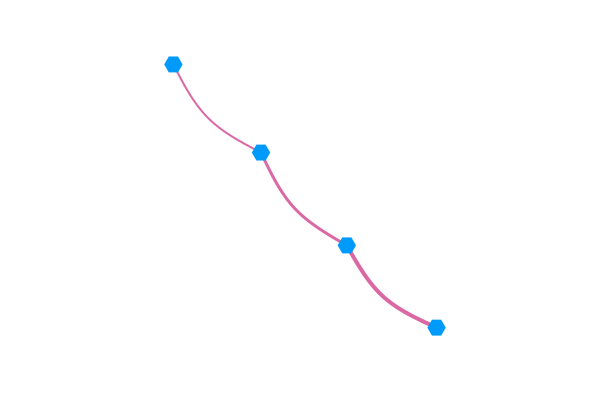
graphplot(g, edge_width=(s,d,w) -> get_prop(g, Edge(s,d), :weight))

edgewidths
Although the API is not quite the same as the one from the OP. I have wondered if it would be a good idea to let users store formatting suggestions in a MetaGraph in some sort of standard format and have graphplot parse that information and produce the right keyword arguments. In my proposed idea, the above example would become:

using MetaGraphs
using LightGraphs
using GraphRecipes
using Plots

g = MetaGraph(5)

add_edge!(g, 1,2)
add_edge!(g, 1,3)
add_edge!(g, 3,4)

set_prop!(g, Edge(1,2), :edge_width, 2.)
set_prop!(g, Edge(1,3), :edge_width, 3.)
set_prop!(g, Edge(3,4), :edge_width, 4.)

graphplot(g)

Sign up for free to join this conversation on GitHub. Already have an account? Sign in to comment
Projects
None yet
Development

No branches or pull requests

3 participants