Visualizing a table in weave report? #200
Comments
|
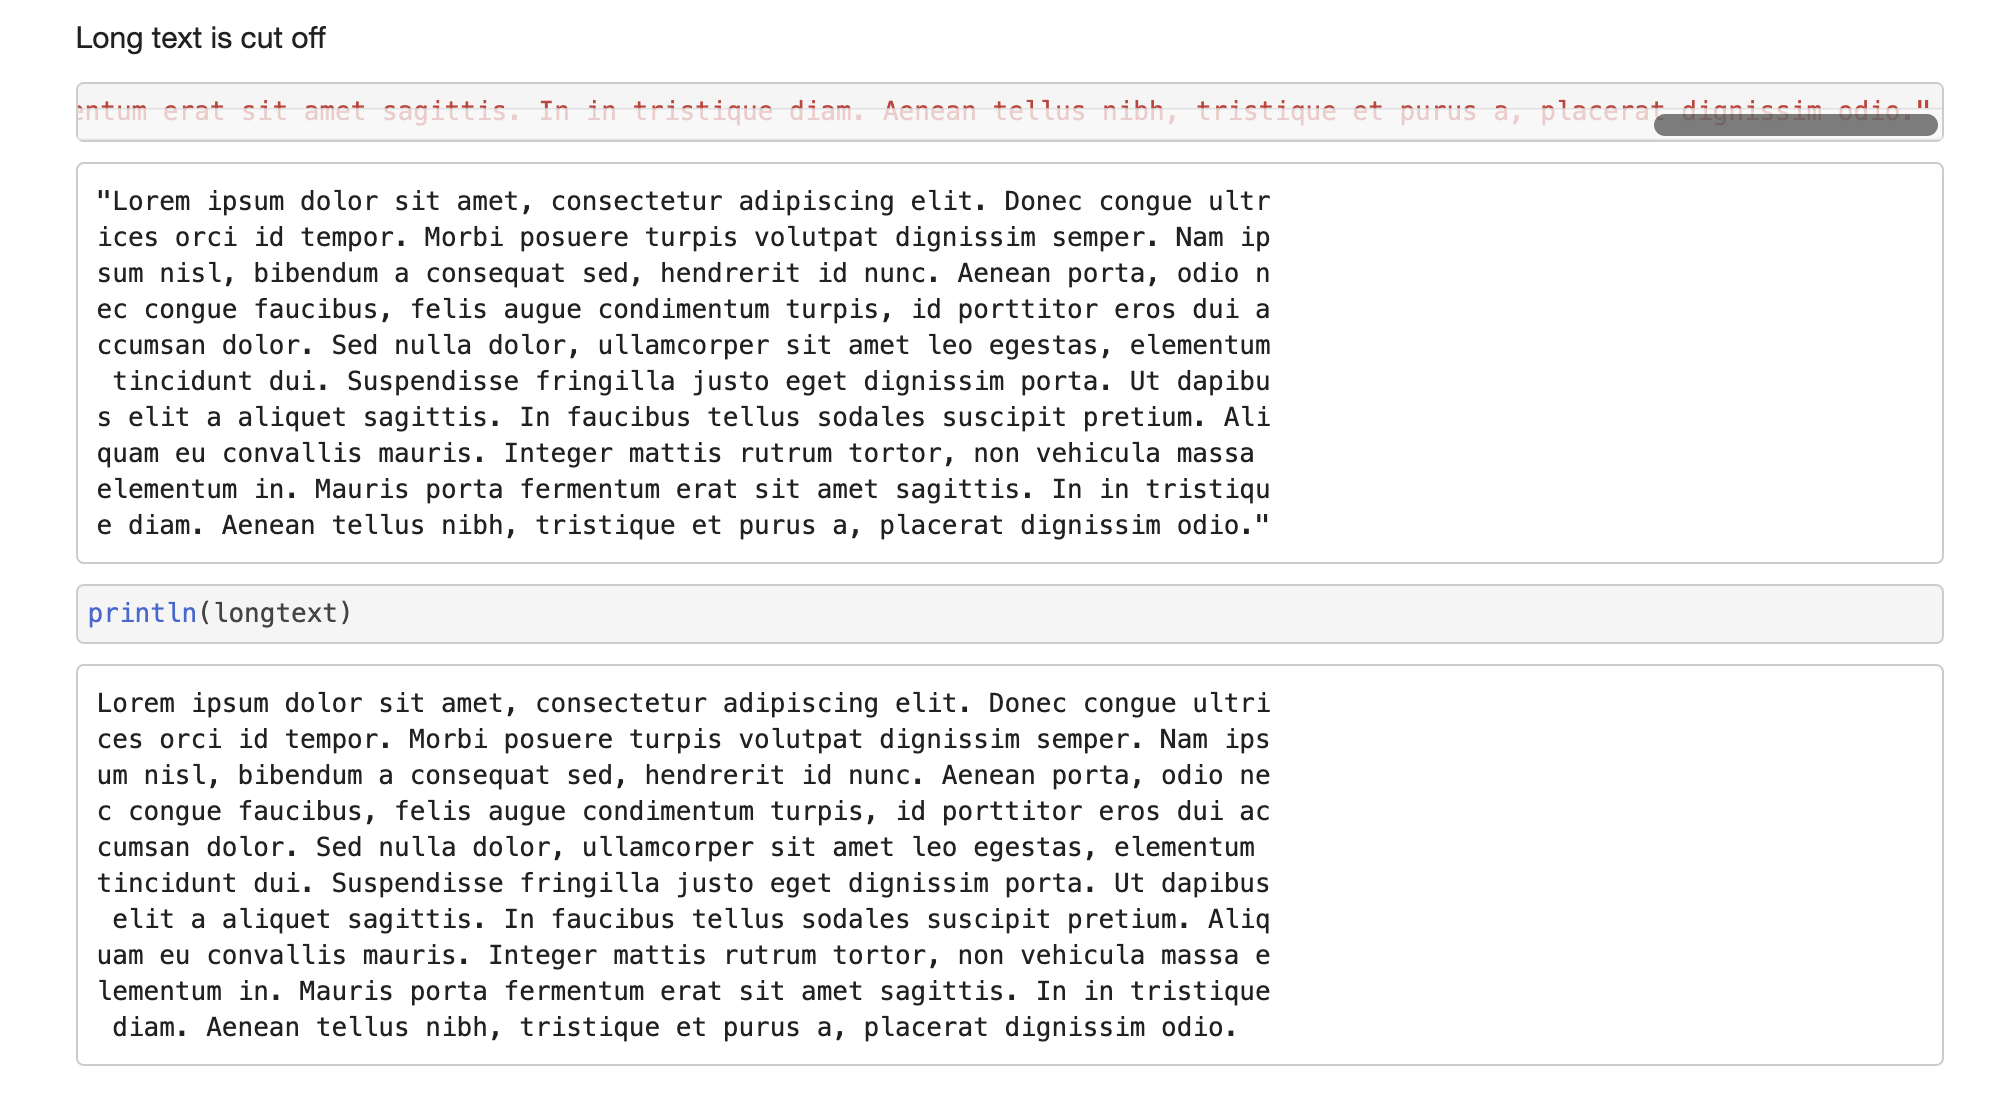
Came with a similar issue - large tables generate giant output. I was hoping Long text doesn't take up the full screen:
Large tables are rendered in their entirety, and
|

|
Note: I figured out how to do this with
results in:
Unfortunately, the |

|
You can also use Latexify.jl for this. This should work with both dataframes and matrices. It can output markdown tables which work well with Weave.jl. |
This works! The data type row doesn't show up. Are there any cosmetic capabilities of this package? For example adding borderlines, changing strings to \text{string} (i.e. "green" => |

|
There are some configurations that you can make along those lines but it may not be perfect yet. The kwargs M = [23.23 "hello there"; :(x/y) 3//4]
using LaTeXStrings
Latexify.latexraw(s::String; kwargs...) = LaTeXString("\\text{$s}")
latexify(M; env=:mdtable)That way, you can still get the built-in number formatting, etc to work. There is currently no way of adding lines to a markdown table from latexify but feel free to file issues/PRs about missing functionality. Also, have a look at the package documentation. |
|
I've found that writing custom # Customized output for DataFrame to HTML
function Base.display(report::Weave.Report, m::MIME"text/html", data::DataFrame)
function wrap(ss)
fig_w, fig_h = get(report.cur_chunk.options, :tab_width, 8), get(report.cur_chunk.options, :tab_height, 6)
return "<div style=\"width:$(fig_w)in;height:$(fig_h)in;line-height:2em;overflow:auto;padding:0.1in;\">"*ss*"</div>"
end
io = IOBuffer()
show(IOContext(io, :limit => false), m, data, summary=false, eltypes=false)
report.rich_output *= string('\n', wrap(String(take!(io))))
end
Base.display(report::Weave.Report, m::MIME"text/html", data::HTML) =
report.rich_output *= string('\n', data.content) |
|
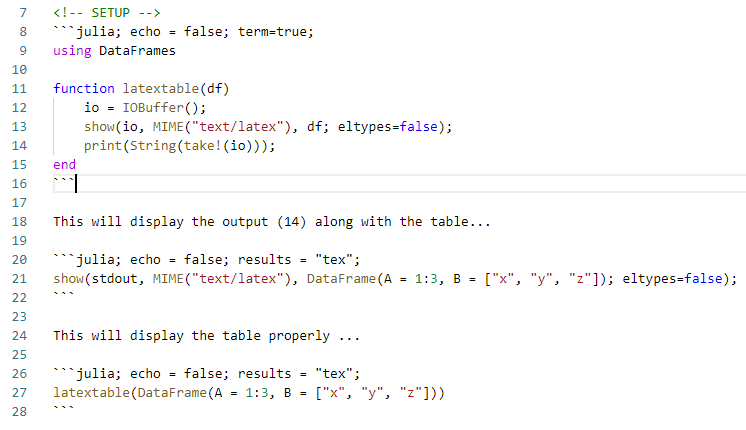
In general I think the show() function should work. However even though I include the semicolon ";" at the end, the result (14) is still displayed along with the table. Therefore a simple function can be used to display without the show() function result. Below is my code and result.
|

|
I fought for a while trying to weave this table, but I eventually got something working. julia> df
7×7 DataFrame
Row │ Material Maximum Temperature m₂ m₃ m₄ m₅ ϵₚ
│ String String Expr Expr Expr Float64 Float64
─────┼─────────────────────────────────────────────────────────────────────────────────────────────────────────────────────────────────────────────
1 │ Ferritic steel 900°F (480°C) 0.6 * (1.0 - R) 2 * log(1 + El / 100) log(100 / (100 - RA)) 2.2 2.0e-5
2 │ Austenitic stainless steel and n… 900°F (480°C) 0.75 * (1.0 - R) 3 * log(1 + El / 100) log(100 / (100 - RA)) 0.6 2.0e-5
3 │ Duplex stainless steel 900°F (480°C) 0.7 * (0.95 - R) 2 * log(1 + El / 100) log(100 / (100 - RA)) 2.2 2.0e-5
4 │ Precipitation hardening, nickel … 1000°F (540°C) 1.09 * (0.93 - R) 1 * log(1 + El / 100) log(100 / (100 - RA)) 2.2 2.0e-5
5 │ Aluminum 250°F (120°C) 0.52 * (0.98 - R) 1.3 * log(1 + El / 100) log(100 / (100 - RA)) 2.2 5.0e-6
6 │ Copper 150°F (65°C) 0.5 * (1.0 - R) 2 * log(1 + El / 100) log(100 / (100 - RA)) 2.2 5.0e-6
7 │ Titanium and zirconium 500°F (260°C) 0.5 * (0.98 - R) 1.3 * log(1 + El / 100) log(100 / (100 - RA)) 2.2 2.0e-5
julia> latexify(df)
ERROR: in Latexify.jl:
You are trying to create latex-maths from a `String` that cannot be parsed as
an expression: `Ferritic steel`.
I tried extending using DataFrames, Latexify, LaTeXStrings
#+ results="hidden"
function beautify(df::DataFrame)
bdf = copy(df)
for col in names(bdf) # latexify all expressions
if eltype(bdf[!, col]) === Expr
transform!(bdf, col => ByRow(latexify), renamecols=false)
end
end
io = IOBuffer();
show(io, MIME("text/latex"), bdf; eltypes = false);
return print(String(take!(io)));
end
#' # Table KM-620
#+ results="tex"
beautify(df)
PrettyTables initially gave similar results where the Unicode characters would not appear. using DataFrames, Latexify, LaTeXStrings, PrettyTables
#+ results="hidden"
function beautify(df::DataFrame)
bdf = copy(df)
for col in names(bdf) # latexify all expressions
if eltype(bdf[!, col]) === Expr
transform!(bdf, col => ByRow(latexify), renamecols=false)
end
end
return pretty_table(bdf, backend=Val(:latex), show_subheader = false)
end
#' # Table KM-620
#+ results="tex"
beautify(df)
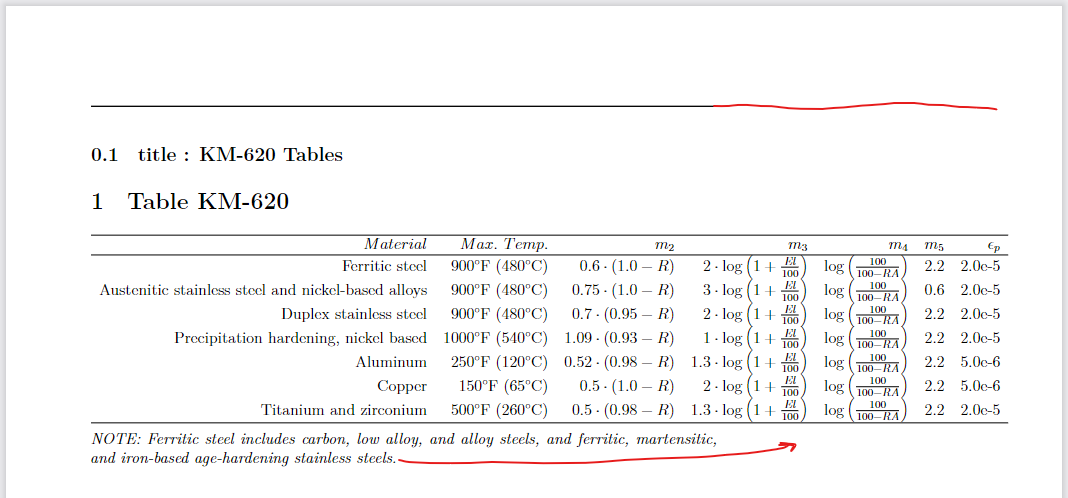
However, I was able to pass LaTeXStrings to replace the header and get PrettyTables to work nicely! using DataFrames, Latexify, LaTeXStrings, PrettyTables
#+ results="hidden"
function beautify(df::DataFrame)
bdf = copy(df)
for col in names(bdf) # latexify all expressions
if eltype(bdf[!, col]) === Expr
transform!(bdf, col => ByRow(latexify), renamecols=false)
end
end
header = [L"Material", L"Max.\ Temp.", L"m_2", L"m_3", L"m_4", L"m_5", L"\epsilon_p"]
return pretty_table(bdf, backend=Val(:latex), header = header)
end
#' # Table KM-620
#+ results="tex"
beautify(df)
My only remaining issue is that the table is too wide to fit on letter paper. One option I found helpful is the ability to adjust the weave(normpath(@__DIR__, "..", "test", "latexify_tables.jl");
doctype = "md2pdf",
out_path = normpath(@__DIR__, "..", "KM620_tables.pdf"),
latex_cmd = ["xelatex", "-shell-escape", "-halt-on-error", "-papersize=11in,8.5in"] # landscape orientation
)It would be better to decrease the font size instead of increasing the paper size to avoid that issue, but I cannot find a None of these worked:
|


Hi! Were you able to get this to render as a table in the pdf output of Weave.jl? Whenever I try to do it, it just outputs the text and does not display any formatted table.. do you happen to have a simpler code example or the full code example so I can learn from it? Thanks! |
Hi
Is there a proper way to render tables in weave reports?
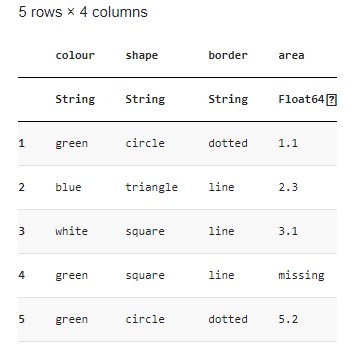
Following #125, I've tried to display a dataframe following the example provided at this page, but the output is not as visually appealing as I'd hoped.
The problem is that a line showing the number of rows and columns shows up on top of the data frame, as can be observed in the attached image. Furthermore, under the headline, I get a row showing the type of data in their respective columns. I haven't been able to remove these.
I'm not bound to using dataframes, so I don't mind switching to any other way of visualizing tables using Weave.jl
Thanks in advance
The text was updated successfully, but these errors were encountered: