This SW creates and displays a colormap of the historical market prices autocorrelation-
-
Use WEB site https://leonidmtertitski.github.io/ or copy all files to a local folder and then open index.html with Google Chrome.
-
When you start it the first time from the local folder you need to click the "Choose a file..." button and select a local csv file with the format Open, High, Low and Close values (you can use provided TEST.csv file as example).
You can select your own csv file with historical Open, High, Low, Close data: use Yahoo (https://help.yahoo.com/kb/SLN2311.html) to download historical data.
SGraph calculates autocorrelation and potential profit (for one market share) by using autocorrelation, historical data and the following every day strategy:
-
If you do not have shares, then buy when market opens.
-
Set "sell limit" to: "Price at Open" x "Calculated by SGraph recommendation".
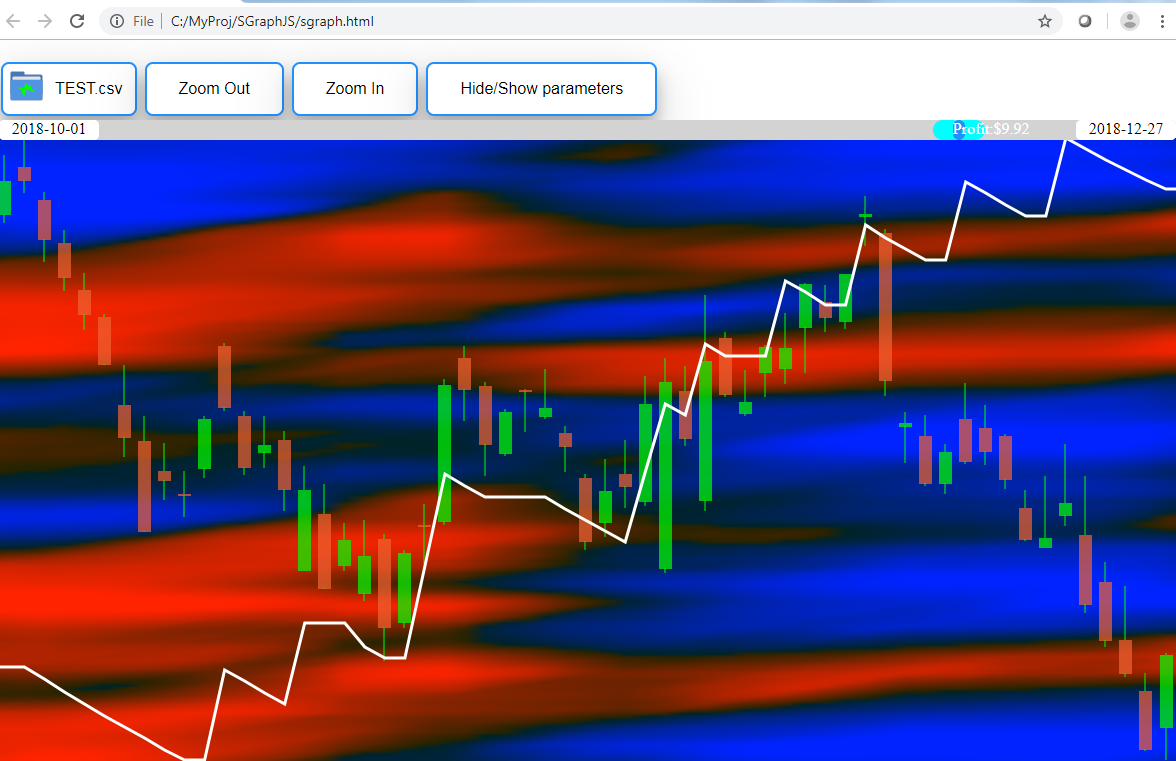
The X, Y color of colormap calculated on the basis of Time (X) and time difference between correlation intervals (Y). Red color - "good" correlation, Blue - "bad".
The following screen shot shows the autocorrelation colormap and the graphic of profit (calculated on the basis of the maximum correlation):