Theories taken from Think-OS
[ Think-OS ] ( Thanks Ko Thet Khine for sharing this awesome book )
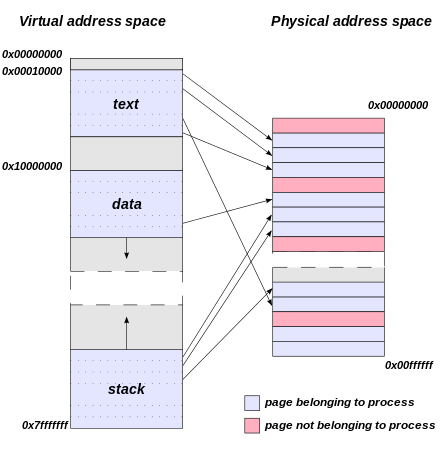
Virtual Memory
- most operating systems provide virtual memory, which means that programs never deal with physical addresses, and don't have to know how much physical memory is available.
- On a 32-bit system, virtual addresses are 32 bits, which means that the virtual address space runs from 0 to 0xFFFFFFFF. The size of this address space is 232 bytes, or 4 GiB.
Memory Segments
[ Higher Address ]
Kernel Space - User cannot access this area
------------------------------------------------------------------
stack segment -> stack frame = arg and local variables of function
|
| ( Grow down to lower )
------------------------------------------------------------------
^
^ ( Grow up to higher )
heap segment -> contains chunks of memory allocated at run time
------------------------------------------------------------------
global segment -> .bss = global variables and local variables that are declared static
static segment -> .data = Initialized global variables
code segment -> .text = Assembly Instructions
[ Lower Address ]
aspace.c
#include <stdio.h>
#include <stdlib.h>

int global;

int times_called()
{
    static int counter = 0;
    counter++;
    printf ("Address of static variable %p\n", &counter);
    return counter;
}

int main ()
{
    int local = 5;
    void *p = malloc(128);
    char *s = "Hello, World";

    printf ("Address of main is %p\n", main);
    printf ("Address of global is %p\n", &global);
    printf ("Address of local is %p\n", &local);
    printf ("p points to %p\n", p);
    printf ("s points to %p\n", s);
    times_called();
}
Result
luna@luna-LOL:~/Desktop/pwn$ ./aspace
Address of main is 0x80484ca
Address of global is 0x804a02c
Address of local is 0xbff1d800
p points to 0x9ea5008
s points to 0x804862f
Address of static variable 0x804a028
Address Translation
Most processors provide a memory management unit (MMU) that sits between the CPU and main memory. The MMU performs fast translation between VAs and PAs
(CPU) --VA--> (MMU) --PA--> (MCU)

MMU splits
 - page number -> look up in TLB ( page table cache in kernel )
 - offset

Page Table = mapping of VA page no -> PA page no
[ Page Table Wiki ]
Memory Examining with GDB [ GNU Debugger ]
GDB Cheatsheets [ 1 ]
Compiling with GNU Debug Options ( We don't know assembly for now )
luna@luna-LOL:~/Desktop/pwn$ gcc -g -o aspace-d aspace.c
loading in gdb
gdb ./aspace-d
browsing source
(gdb) list
1       #include <stdio.h>
2       #include <stdlib.h>
3
4       int global;
5
6       int times_called()
7       {
8           static int counter = 0;
9           counter++;
10          printf ("Address of static variable %p\n", &counter);
(gdb) list 1,20
1       #include <stdio.h>
2       #include <stdlib.h>
3
4       int global;
5
6       int times_called()
7       {
8           static int counter = 0;
9           counter++;
10          printf ("Address of static variable %p\n", &counter);
11          return counter;
12      }
13
14      int main ()
15      {
16          int local = 5;
17          void *p = malloc(128);
18          char *s = "Hello, World";
19
20          printf ("Address of main is %p\n", main);
setting a breakpoint
(gdb) break main
Breakpoint 1 at 0x80484db: file aspace.c, line 15.
breakpoint info
(gdb) info b
Num     Type           Disp Enb Address    What
1       breakpoint     keep y   0x080484db in main at aspace.c:15
delete breakpoint
del 1
setting a breapoint with line number
(gdb) b 14
Breakpoint 2 at 0x80484db: file aspace.c, line 14.
run program and hit the breakpoint
(gdb) run
Starting program: /home/luna/Desktop/pwn/aspace-d

Breakpoint 2, main () at aspace.c:15
15      {
Registers Info ( currently skip )
(gdb) info registers
eax            0xb7fbcdbc       -1208234564
ecx            0xbffff530       -1073744592
edx            0xbffff554       -1073744556
ebx            0x0      0
esp            0xbffff500       0xbffff500
ebp            0xbffff518       0xbffff518
esi            0xb7fbb000       -1208242176
edi            0xb7fbb000       -1208242176
eip            0x80484db        0x80484db <main+17>
eflags         0x286    [ PF SF IF ]
cs             0x73     115
ss             0x7b     123
ds             0x7b     123
es             0x7b     123
fs             0x0      0
gs             0x33     51
Run Next lnstruction
(gdb) ni
0x080484e1      15      {
Stack frame ( ebp,esp )
esp [Stack-Pointer]            0xbffff500

[ Local Variables store here ]

ebp [Stack-Base-Pointer]       0xbffff518
Run after assigning local variable and calculate stack size
(gdb) print 0xbffff518-0xbffff500
$1 = 24
(gdb) print/x 0xbffff518-0xbffff500
$2 = 0x18
Examining the stack ( main function )
(gdb) x/24x 0xbffff500
0xbffff500:     0x00000005     0xbffff5c4      0xbffff5cc      0xa7259f00
0xbffff510:     0xb7fbb3dc      0xbffff530      0x00000000      0xb7e21637
0xbffff520:     0xb7fbb000      0xb7fbb000      0x00000000      0xb7e21637
0xbffff530:     0x00000001      0xbffff5c4      0xbffff5cc      0x00000000
0xbffff540:     0x00000000      0x00000000      0xb7fbb000      0xb7fffc04
0xbffff550:     0xb7fff000      0x00000000      0xb7fbb000      0xb7fbb000
0x00000005 => local variable at the top of the stack
Run after malloc() and examine the Heap
# Know the Heap Address
(gdb) info proc mappings
process 5041
Mapped address spaces:

        Start Addr   End Addr       Size     Offset objfile
         0x8048000  0x8049000     0x1000        0x0 /home/luna/Desktop/pwn/aspace-d
         0x8049000  0x804a000     0x1000        0x0 /home/luna/Desktop/pwn/aspace-d
         0x804a000  0x804b000     0x1000     0x1000 /home/luna/Desktop/pwn/aspace-d
         0x804b000  0x806c000    0x21000        0x0 [heap]
        0xb7e08000 0xb7e09000     0x1000        0x0
        0xb7e09000 0xb7fb9000   0x1b0000        0x0 /lib/i386-linux-gnu/libc-2.23.so
        0xb7fb9000 0xb7fbb000     0x2000   0x1af000 /lib/i386-linux-gnu/libc-2.23.so
        0xb7fbb000 0xb7fbc000     0x1000   0x1b1000 /lib/i386-linux-gnu/libc-2.23.so
        0xb7fbc000 0xb7fbf000     0x3000        0x0
        0xb7fd5000 0xb7fd6000     0x1000        0x0
        0xb7fd6000 0xb7fd9000     0x3000        0x0 [vvar]
        0xb7fd9000 0xb7fdb000     0x2000        0x0 [vdso]
        0xb7fdb000 0xb7ffe000    0x23000        0x0 /lib/i386-linux-gnu/ld-2.23.so
        0xb7ffe000 0xb7fff000     0x1000    0x22000 /lib/i386-linux-gnu/ld-2.23.so
        0xb7fff000 0xb8000000     0x1000    0x23000 /lib/i386-linux-gnu/ld-2.23.so
        0xbffdf000 0xc0000000    0x21000        0x0 [stack]
++++++++++++++++++++++++++++++++++++++++++++++++++++++++++++++++++
# Heap
0x804b000  0x806c000    0x21000        0x0 [heap]
++++++++++++++++++++++++++++++++++++++++++++++++++++++++++++++++++
# Examine
(gdb) x/24x 0x804b000
0x804b000:      0x00000000      0x00000089      0x00000000      0x00000000
0x804b010:      0x00000000      0x00000000      0x00000000      0x00000000
0x804b020:      0x00000000      0x00000000      0x00000000      0x00000000
0x804b030:      0x00000000      0x00000000      0x00000000      0x00000000
0x804b040:      0x00000000      0x00000000      0x00000000      0x00000000
0x804b050:      0x00000000      0x00000000      0x00000000      0x00000000
Let's skip heap for now
Reference
- https://sourceware.org/gdb/wiki/
- I read Shell Coders Handbook, Hacking: The Art of Exploitation and so many blogposts for this ( at least 3 years ago and I don't remember all )
- Think-OS for Operation System Concepts
- Modern Operating System Book