New issue
Have a question about this project? Sign up for a free GitHub account to open an issue and contact its maintainers and the community.
By clicking “Sign up for GitHub”, you agree to our terms of service and privacy statement. We’ll occasionally send you account related emails.
Already on GitHub? Sign in to your account
yscale=log10 broken on bar plots?
#1087
Comments
|
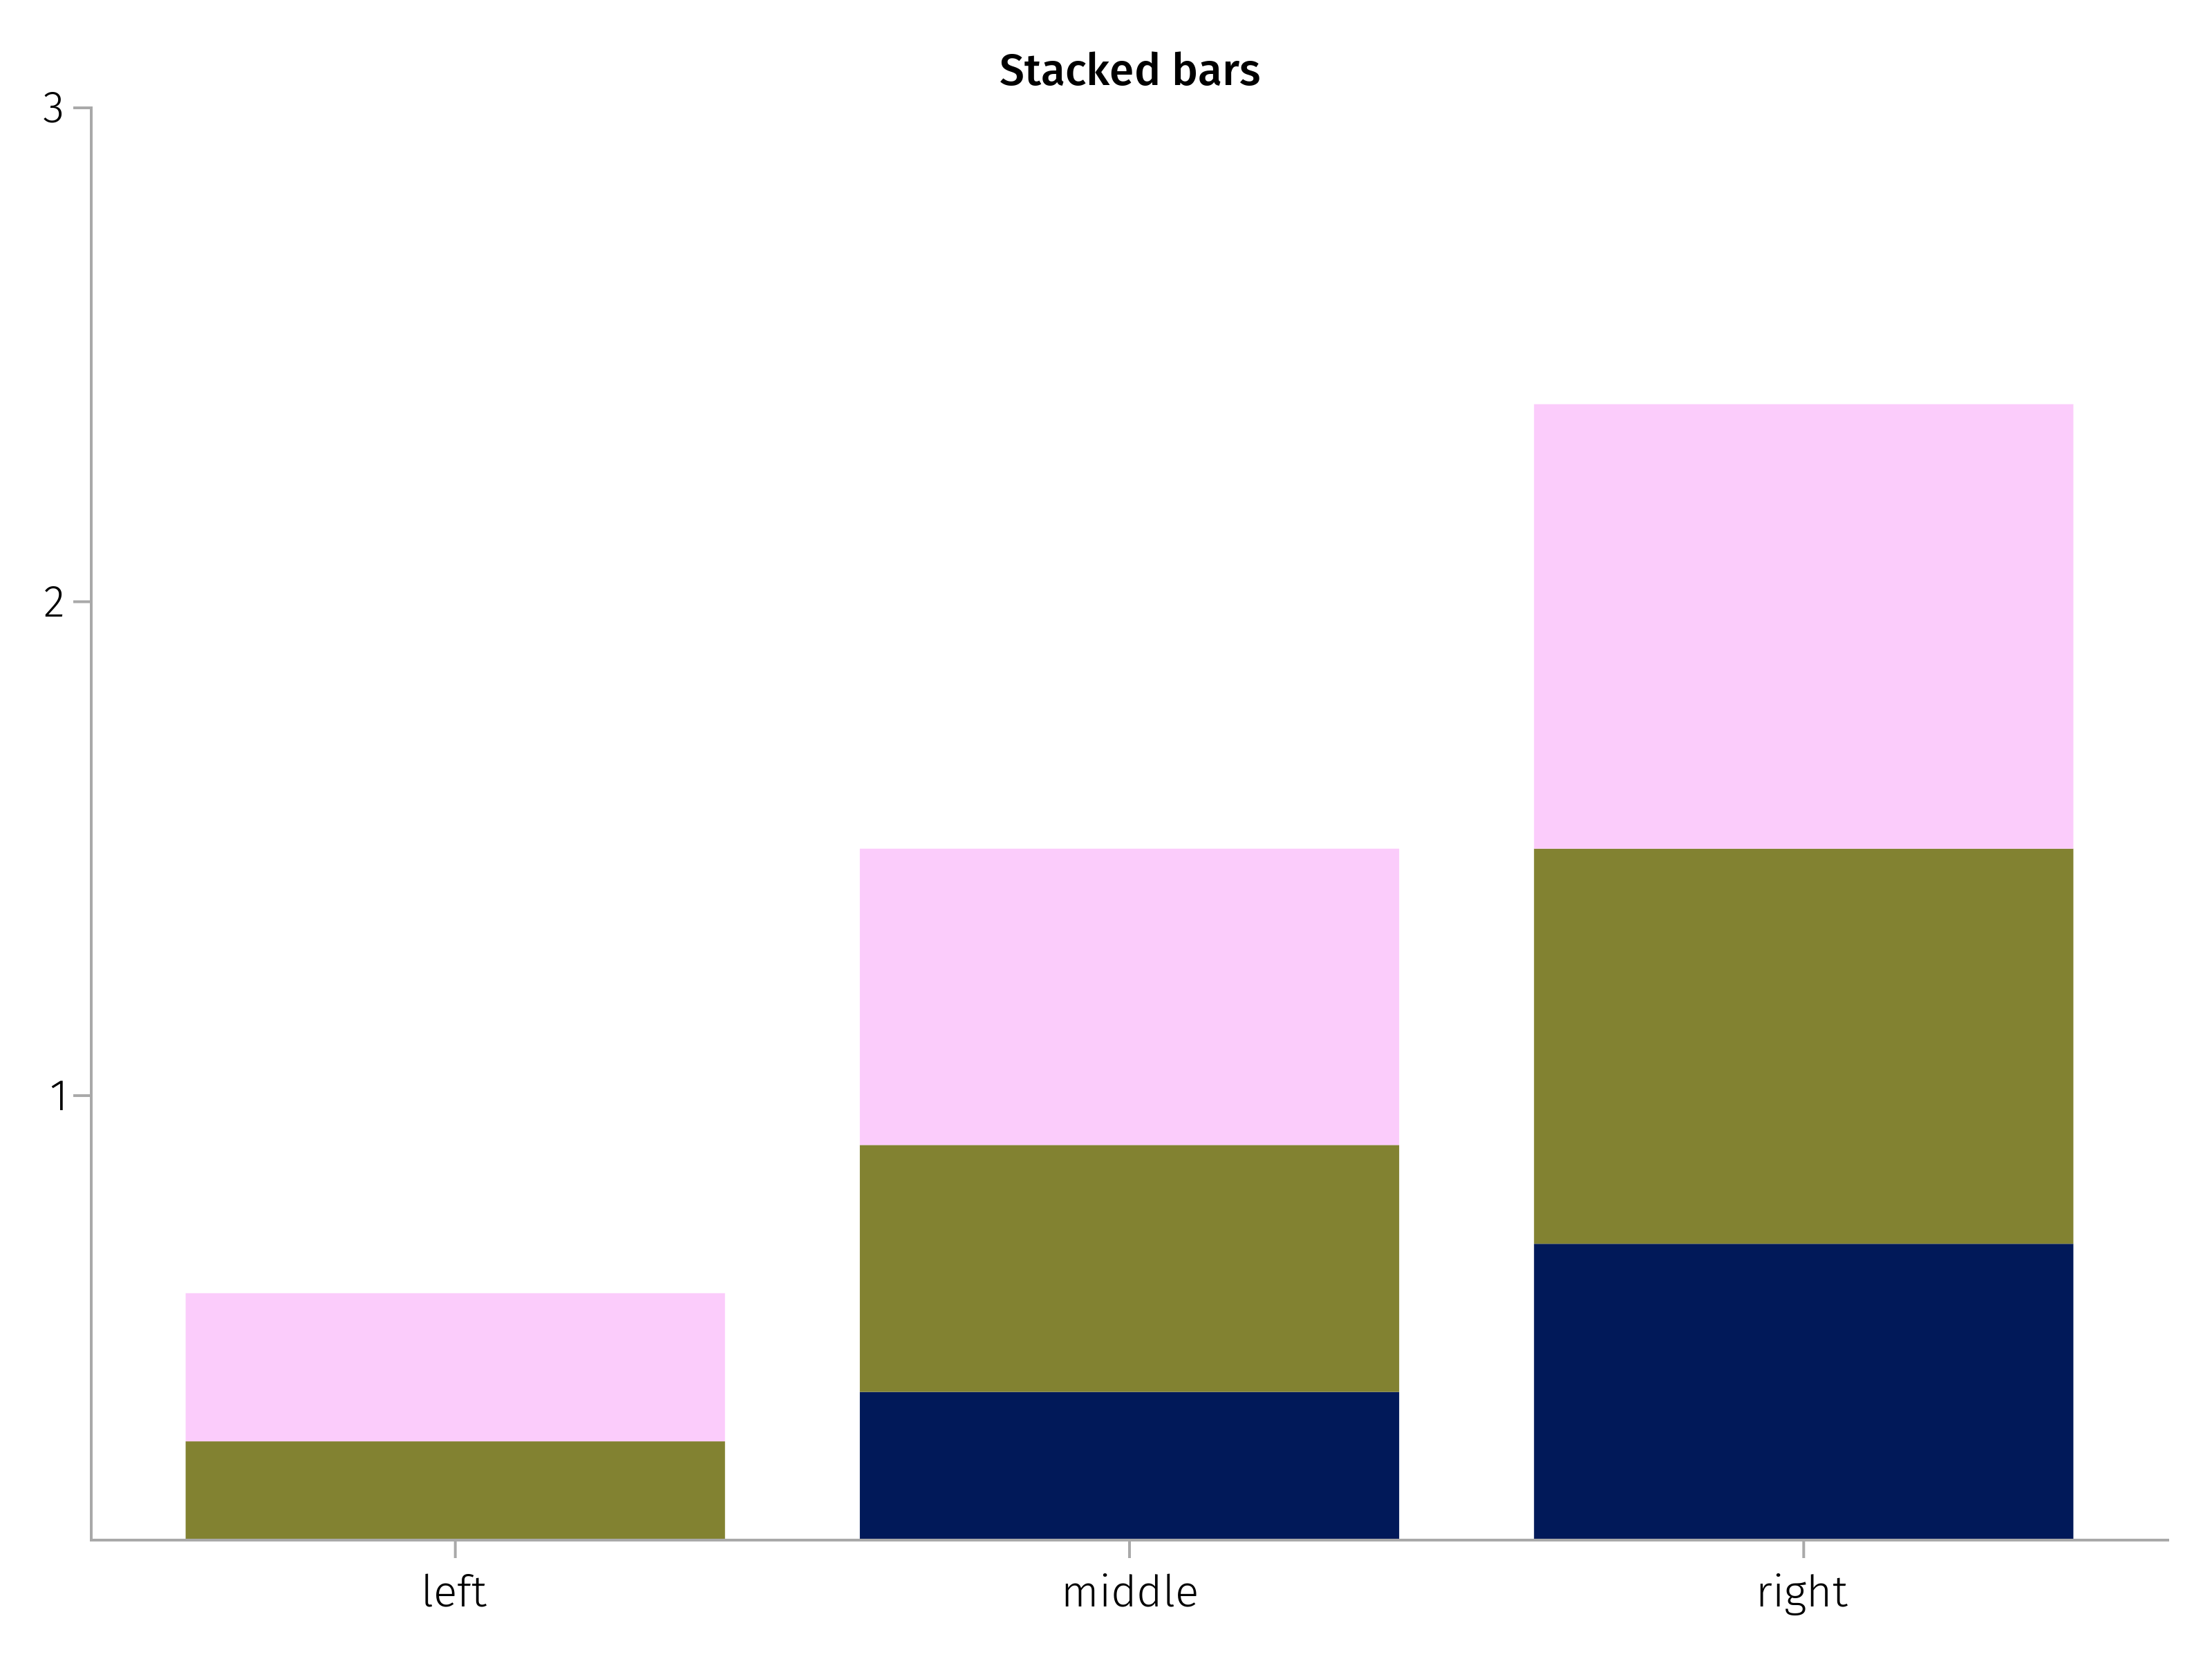
Isn't that the zero problem again? That the blue ones are missing because they start from 0 which is invalid for log10? |
|
Oh, so the whole portion of the bar disappears? I thought we would just get a “view” into the ylims-specified portion of the plot. |
|
So if I try MethodError: no method matching defined_interval(::var"#281#282"{typeof(log10), typeof(zero), typeof(>)})
Closest candidates are:
defined_interval(!Matched::typeof(identity)) at /Users/eph/.julia/packages/Makie/06MOy/src/makielayout/layoutables/axis.jl:1268
defined_interval(!Matched::Union{typeof(log), typeof(log10), typeof(log2)}) at /Users/eph/.julia/packages/Makie/06MOy/src/makielayout/layoutables/axis.jl:1269
defined_interval(!Matched::typeof(sqrt)) at /Users/eph/.julia/packages/Makie/06MOy/src/makielayout/layoutables/axis.jl:1270
I guess that means I need to do it manually? I.e. log everything myself and try to fix the yticks? |
|
Well every plot object needs to be transformed by the transformation function, independent of whether it ends up outside of the current limits. As log(0) is not defined but the closest thing would be -Inf, you can't just replace 0 with 0 as in your example. log(1) = 0 so that value is already taken :) The only option is to feed in values that don't reach zero. Which is why for normal barplots you can use the fill_to attribute, but I'm not sure if that works with stacked plots. |
|
I'd be interested to learn what other plotting packages do in this case, I can imagine some try to do some workarounds so they don't have to error. |
True, though my actual data is counts (of lines of code of Julia packages), which are usually 10^1 to 10^5, so 1 vs 0 doesn't really matter much. I tried doing it manually but it seems that stacking doesn't work well on the log-scaled axis. I'm not quite sure how it should work actually. But if I log my numbers and add them, that's obviously different than adding them then logging them. The idea was to show how much of each package is docs/test/src with a stacked bar, but since the numbers vary wildly over the package ecosystem, you need to log-scale to see anything (in fact the # of lines of src code is log-normal). |
|
I guess the key thing with log plots is that they are not there to squish high values into a lower domain, but to transform the scale into a multiplicative one. So you have to think about what your multiplicative base is supposed to be, and of course it can't be zero as that can't be multiplied to anything. I often just take like a 10th of the lowest value as that gives a nice visible bar for that one, so basically the lowest value becomes the comparison. |
|
Another option is a log-linear scale, where the scale is linear from 0 to x and log from there on out. I haven't implemented one but it wouldn't be too hard. Those things can also be symmetrical and extend into negative numbers. |
|
Seems like ggplot has a pseudo-log transform, this works: pseudolog(x) = sign(x) * log10(abs(x) + 1)
MakieLayout.defaultlimits(::typeof(pseudolog)) = (0.0, 10.0)
MakieLayout.defined_interval(::typeof(pseudolog)) = -Inf..Inf
inv_pseudolog(x) = sign(x) * (exp10(abs(x)) - 1)
Makie.inverse_transform(::typeof(pseudolog)) = inv_pseudolog
barplot([-10, -1, 0, 1, 10, 100, 1000],
axis = (yscale = pseudolog,)) |

I don't think they should be floating!
If I comment out the

ax.yscale=log10line it looks normal:The text was updated successfully, but these errors were encountered: