#Contents
- Getting Started
- Onboarding with Operations Management Suite
- Manage Workspaces
- Manage omsagent Daemon
- Viewing Linux Data
- Configuring Data Collection
- Agent Logs
- Uninstalling the OMS Agent for Linux
- Compatibility with System Center Operations Manager
- Known Limitations
- Appendices
#Getting Started
The Operations Management Suite Agent for Linux comprises multiple packages. The release file contains the following packages, available by running the shell bundle with --extract:
| Package | Version | Description |
|---|---|---|
| omsagent | 1.1.0 | The Operations Management Suite Agent for Linux |
| omsconfig | 1.1.1 | Configuration agent for the OMS Agent |
| omi | 1.0.8.3 | Open Management Infrastructure (OMI) -- a lightweight CIM Server |
| scx | 1.6.2 | OMI CIM Providers for operating system performance metrics |
| apache-cimprov | 1.0.0 | Apache HTTP Server performance monitoring provider for OMI. Only installed if Apache HTTP Server is detected. |
| mysql-cimprov | 1.0.0 | MySQL Server performance monitoring provider for OMI. Only installed if MySQL/MariaDB server is detected. |
| docker-cimprov | 0.1.0 | Docker provider for OMI. Only installed if Docker is detected. |
Additional Installation Artifacts After installing the OMS agent for Linux packages, the following additional system-wide configuration changes are applied. These artifacts are removed when the omsagent package is uninstalled.
- A non-privileged user named:
omsagentis created. This is the account the omsagent daemon runs as - A sudoers “include” file is created at /etc/sudoers.d/omsagent This authorizes omsagent to restart the syslog and omsagent daemons. If sudo “include” directives are not supported in the installed version of sudo, these entries will be written to /etc/sudoers.
- The syslog configuration is modified to forward a subset of events to the agent. For more information, see the Configuring Data Collection section below
| Required package | Description | Minimum version |
|---|---|---|
| Glibc | GNU C Library | 2.5-12 |
| Openssl | OpenSSL Libraries | 0.9.8e or 1.0 |
| Curl | cURL web client | 7.15.5 |
| Python-ctypes | ||
| PAM | Pluggable authentication Modules |
Note: Either rsyslog or syslog-ng are required to collect syslog messages. The default syslog daemon on version 5 of Red Hat Enterprise Linux, CentOS, and Oracle Linux version (sysklog) is not supported for syslog event collection. To collect syslog data from this version of these distributions, the rsyslog daemon should be installed and configured to replace sysklog,
Upgrade from prior versions (>1.0.0-47) is supported in this release. Performing the installation with the --upgrade command will upgrade all components of the agent to the latest version.
The OMS agent for Linux is provided in a self-extracting and installable shell script bundle. This bundle contains Debian and RPM packages for each of the agent components and can be installed directly or extracted to retrieve the individual packages. One bundle is provided for x64 architectures and one for x86 architectures.
Installing the agent
- Transfer the appropriate bundle (x86 or x64) to your Linux computer, using scp/sftp.
- Install the bundle by using the
--installor--upgradeargument. Note: use the--upgradeargument if any existing packages are installed, as would be the case if the system Center Operations Manager agent for Linux is already installed. To onboard to Operations Management Suite during installation, provide the-w <WorkspaceID>and-s <Shared Key>parameters.
To install and onboard directly:
sudo sh ./omsagent-1.3.0-1.universal.x64.sh --upgrade -w <workspace id> -s <shared key>
To install and onboard directly using an HTTP proxy:
sudo sh ./omsagent-1.3.0-1.universal.x64.sh --upgrade -p http://<proxy user>:<proxy password>@<proxy address>:<proxy port> -w <workspace id> -s <shared key>
To install and onboard to a workspace in FairFax:
sudo sh ./omsagent-1.3.0-1.universal.x64.sh --upgrade -w <workspace id> -s <shared key> -d opinsights.azure.us
To install the agent packages and onboard at a later time:
sudo sh ./omsagent-1.3.0-1.universal.x64.sh --upgrade
To install and onboard to a non-primary workspace:
sudo sh ./omsagent-1.3.0-1.universal.x64.sh --upgrade -w <workspace id> -s <shared key> -m <multi-homing marker>
To extract the agent packages from the bundle without installing:
sudo sh ./omsagent-1.3.0-1.universal.x64.sh --extract
All bundle operations:
Options:
  --extract              Extract contents and exit.
  --force                Force upgrade (override version checks).
  --install              Install the package from the system.
  --purge                Uninstall the package and remove all related data.
  --remove               Uninstall the package from the system.
  --restart-deps         Reconfigure and restart dependent service
  --source-references    Show source code reference hashes.
  --upgrade              Upgrade the package in the system.
  --version              Version of this shell bundle.
  --version-check        Check versions already installed to see if upgradable.
  --debug                use shell debug mode.
  --collectd             Enable collectd.

  -w id, --id id         Use workspace ID <id> for automatic onboarding.
  -s key, --shared key   Use <key> as the shared key for automatic onboarding.
  -d dmn, --domain dmn   Use <dmn> as the OMS domain for onboarding. Optional.
                         default: opinsights.azure.com
                         ex: opinsights.azure.us (for FairFax)
  -p conf, --proxy conf  Use <conf> as the proxy configuration.
                         ex: -p [protocol://][user:password@]proxyhost[:port]
  -a id, --azure-resource id Use Azure Resource ID <id>.
  -m marker, --multi-homing-marker marker
                         Onboard as a multi-homing(Non-Primary) workspace.

  -? | --help            shows this usage text.
##Configuring the agent for use with an HTTP proxy server Communication between the agent and OMS services can use an HTTP or HTTPS proxy server. Both anonymous and basic authentication (username/password) proxies are supported.
Proxy Configuration The proxy configuration value has the following syntax: [protocol://][user:password@]proxyhost[:port]
| Property | Description |
|---|---|
| Protocol | http or https |
| user | Optional username for proxy authentication |
| password | Optional password for proxy authentication |
| proxyhost | Address or FQDN of the proxy server |
| port | Optional port number for the proxy server |
For example: http://user01:password@proxy01.contoso.com:8080
The proxy server can be specified during installation or directly in a file (at any point).
Specify proxy configuration during installation:
The -p or --proxy argument to the omsagent installation bundle specifies the proxy configuration to use.
sudo sh ./omsagent-1.3.0-1.universal.x64.sh --upgrade -p http://<proxy user>:<proxy password>@<proxy address>:<proxy port> -w <workspace id> -s <shared key>
**Define the proxy configuration in a file **
The proxy configuration is set in the file: /etc/opt/microsoft/omsagent/proxy.conf This file can be directly created or edited, but must be readable by the omsagent user. For example:
proxyconf="https://proxyuser:proxypassword@proxyserver01:8080"
sudo echo $proxyconf >>/etc/opt/microsoft/omsagent/proxy.conf
sudo chown omsagent:omiusers /etc/opt/microsoft/omsagent/proxy.conf
sudo chmod 600 /etc/opt/microsoft/omsagent/proxy.conf
sudo /opt/microsoft/omsagent/bin/service_control restart [<workspace id>]
Removing the proxy configuration To remove a previously defined proxy configuration and revert to direct connectivity, remove the proxy.conf file:
sudo rm /etc/opt/microsoft/omsagent/proxy.conf
sudo /opt/microsoft/omsagent/bin/service_control restart [<workspace id>]
If a workspace ID and key were not provided during the bundle installation, the agent must be subsequently registered with Operations Management Suite.
Run the omsadmin.sh command supplying the workspace id and key for your workspace. This command must be run as root (w/ sudo elevation):
cd /opt/microsoft/omsagent/bin
sudo ./omsadmin.sh -w <WorkspaceID> -s <Shared Key>
- Create the file
/etc/omsagent-onboard.confThe file must be readable and writable for root.sudo vi /etc/omsagent-onboard.conf - Insert the following lines in the file with your Workspace ID and Shared Key:
WORKSPACE_ID=<WorkspaceID>
SHARED_KEY=<Shared Key>
- Onboard to OMS:
sudo /opt/microsoft/omsagent/bin/omsadmin.sh - The file will be deleted on successful onboarding
From 1.3.0-1, OMSAgent supports to onboard the agent to multiple workspaces. Run the omsadmin.sh command supplying the workspace id and key for your workspace, and -m to indicate secondary workspace:
cd /opt/microsoft/omsagent/bin
sudo ./omsadmin.sh -w <workspace id> -s <shared key> -m <multi-homing marker>
NOTE: Secondary workspace is currently unable to pull the configuration from OMS service. We are working on it.
Reference Onboarding using a file Add the following line into /etc/omsagent-onboard.conf
MULTI_HOMING_MARKER=<any string, e.g. MySecondaryWS>
From 1.3.0-1, OMSAgent supports onboarding to multiple workspaces. Here are the commands for workspace management:
sudo sh /opt/microsoft/omsagent/bin/omsadmin.sh -l
Sample result for an agent onboarded to 2 workspaces:
Primary Workspace: 000c7bcd-28d2-453a-84bd-8523e396f600    Success(OMSAgent Registered)
Workspace(MySecondaryWS): ffffb0c0-7fac-4159-987c-000271282eff    Success(OMSAgent Registered)
sudo sh /opt/microsoft/omsagent/bin/omsadmin.sh -x <workspace id>
sudo sh /opt/microsoft/omsagent/bin/omsadmin.sh -X
From 1.3.0-1, we will register omsagent daemon for each onboarded workspace. The daemon name is omsagent-<workspace-id> You can use /opt/microsoft/omsagent/bin/service_control command to operate the daemon.
sudo sh /opt/microsoft/omsagent/bin/service_control start|stop|restart|enable|disable [<workspace id>]
The workspace id is an optional parameter. If it is specified, it will only operate on the workspace-specific daemon. Otherwise, it will operate on all the daemons.
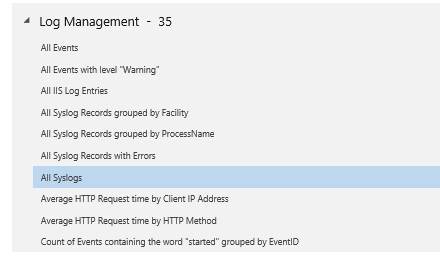
From within the Operations Management Suite portal, access the Log Search tile. Predefined syslog search queries can be found in the Log Management grouping.
From within the Operations Management Suite portal, access the Log Search tile. Enter in the search bar. "* (Type=Perf)" to view all performance counters.

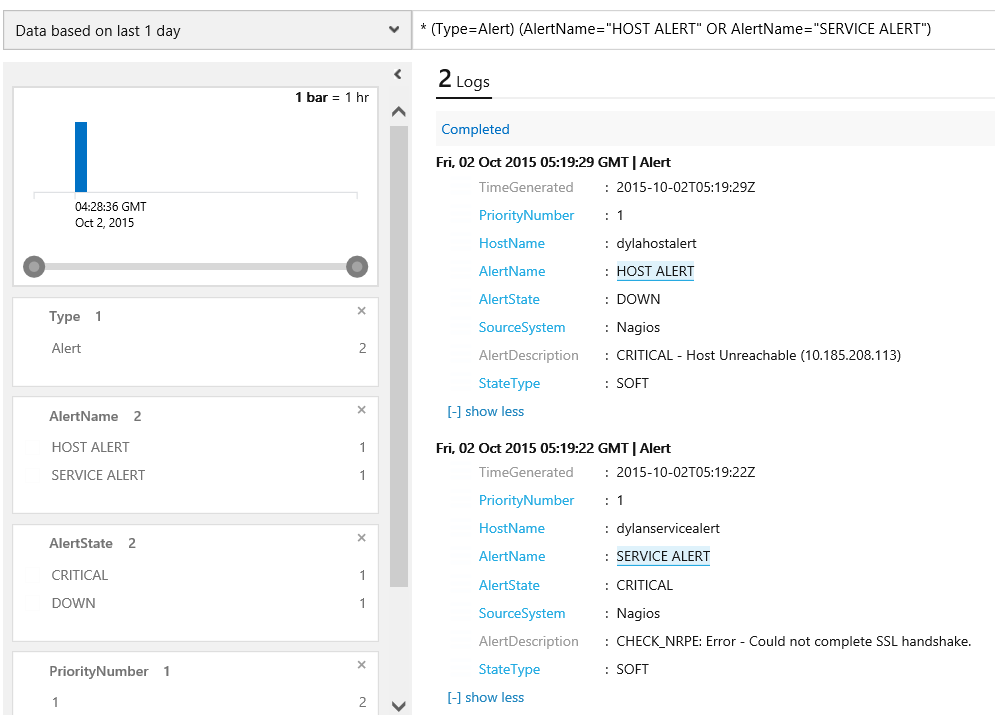
From within the Operations Management Suite portal, access the Log Search tile. Enter in the search bar, "* (Type=Alert) SourceSystem=Nagios" to view all Nagios Alerts.
From within the Operations Management Suite portal, access the Log Search tile. Enter in the search bar, "* (Type=Alert) SourceSystem=Zabbix" to view all Zabbix Alerts.

Data to collect (e.g. syslog events and performance metrics) can be defined centrally in the Operations Management Suite portal, or on the agents directly. Selections that you define in the portal for data collection will be applied to the agents within 5 minutes.
- Log into the Operations Management Suite Portal
- From the Overview dashboard, select Settings
- From the Settings page, click on the Data link
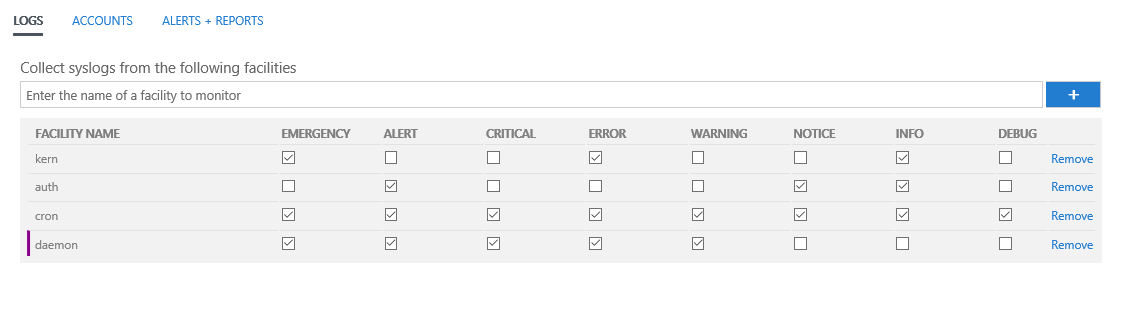
- Select Syslogs from the left-hand settings list
- Add or remove facilities to collect. For each facility, you can select relevant severities to collect
- Log into the Operations Management Suite Portal
- From the Overview dashboard, select Settings
- From the Settings page, click on the Data link
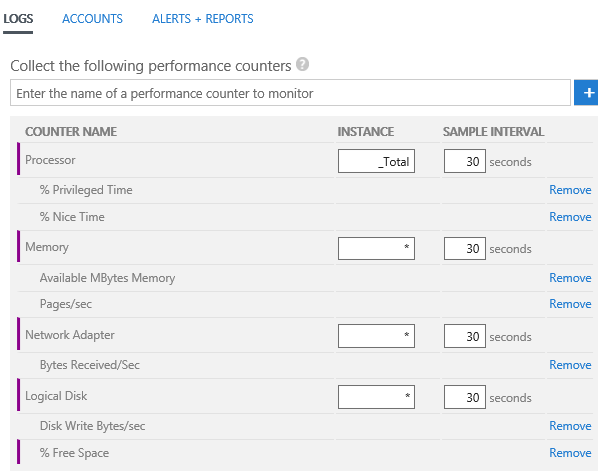
- Select Linux performance counters from the left-hand settings list
- Add or remove performance counters to collect. A complete list of available performance counters is available in the Appendix of this document.
- You can define a collection interval for each Object (i.e. category of performance counters).
- Optionally, you can filter all performance counters for an *Object to a subset of instances. This is done by providing a Regular Expression value for the InstanceName input. For example:
- * - will match all instances
- (/|/var) – will match Logical Disk instances named:
/or/var - _Total – will match Processor instances named _Total
If MySQL Server or MariaDB Server is detected on the computer when the omsagent bundle is installed a performance monitoring provider for MySQL Server will be automatically installed. This provide connects to the local MySQL/MariaDB server to expose performance statistics. MySQL user credentials must be configured so that the provider can access the MySQL Server.
To define a default user account for the MySQL server on localhost: Note: the credentials file must be readable by the omsagent account. Running the mycimprovauth command as omsgent is recommended.
sudo su omsagent -c '/opt/microsoft/mysql-cimprov/bin/mycimprovauth default 127.0.0.1 <username> <password>'

sudo /opt/omi/bin/service_control restart [<workspace id>]
Alternatively, you can specify the required MySQL credentials in a file, by creating the file: /var/opt/microsoft/mysql-cimprov/auth/omsagent/mysql-auth. For more information on managing MySQL credentials for monitoring through the mysql-auth file, see Appendix C of this document.
Reference the Appendix B of this document for details on object permissions required by the MySQL user to collect MySQL Server performance data.
If Apache HTTP Server is detected on the computer when the omsagent bundle is installed, a performance monitoring provider for Apache HTTP Server will be automatically installed. This provider relies on an Apache “module” that must be loaded into the Apache HTTP Server in order to access performance data. The module can be loaded with the following command:
sudo /opt/microsoft/apache-cimprov/bin/apache_config.sh -c
To unload the Apache monitoring module, run the following command:
sudo /opt/microsoft/apache-cimprov/bin/apache_config.sh -u
Syslog events and performance counters to collect can be specified in configuration files on the Linux computers. If you opt to configure data collection through editing of the agent configuration files, you should disable the centralized configuration or add custom configurations to the omsagent.d/ directory. Instructions are provided below to configure data collection in the agent’s configuration files as well as to disable central configuration for all OMS agents for Linux, or individual computers.
###omsagent.d
The directory /etc/opt/microsoft/omsagent/conf/omsagent.d is an include path for omsagent configuration files. Any *.conf files in this directory will be included in the configuration for omsagent. The files must be readable by the omsagent user, and will not be modified by centralized configuration options. This allows specific customizations to be added on the Linux machine, while still using centralized configuration.
In order to disable central configuration for all Linux computers ensure that the check marks in Linux Performance Counters and Syslog are unchecked under the data section in settings.
The centralized configuration of data collection can be disabled for an individual Linux computer with the OMS_MetaConfigHelper.py script. This can be useful if a subset of computers should have a specialized configuration.
To disable centralized configuration:
sudo /opt/microsoft/omsconfig/Scripts/OMS_MetaConfigHelper.py --disable
To re-enable centralized configuration:
sudo /opt/microsoft/omsconfig/Scripts/OMS_MetaConfigHelper.py -enable
Syslog events are sent from the syslog daemon (e.g. rsyslog or syslog-ng) to a local port the agent is listening on (by default port 25224). When the agent is installed, a default syslog configuration is applied. This can be found at:
• Rsyslog: /etc/rsyslog.d/rsyslog-oms.conf
• Syslog-ng: /etc/syslog-ng/syslog-ng.conf
The default OMS Agent syslog configuration uploads syslog events from all facilities with a severity of warning or higher.
Note: if you edit the syslog configuration, the syslog daemon must be restarted for the changes to take effect.
The default syslog configuration for the OMS agent for Linux is:
kern.warning       @127.0.0.1:25224
user.warning       @127.0.0.1:25224
daemon.warning     @127.0.0.1:25224
auth.warning       @127.0.0.1:25224
syslog.warning     @127.0.0.1:25224
uucp.warning       @127.0.0.1:25224
authpriv.warning   @127.0.0.1:25224
ftp.warning        @127.0.0.1:25224
cron.warning       @127.0.0.1:25224
local0.warning     @127.0.0.1:25224
local1.warning     @127.0.0.1:25224
local2.warning     @127.0.0.1:25224
local3.warning     @127.0.0.1:25224
local4.warning     @127.0.0.1:25224
local5.warning     @127.0.0.1:25224
local6.warning     @127.0.0.1:25224
local7.warning     @127.0.0.1:25224
#OMS_facility = all
filter f_warning_oms { level(warning); };
destination warning_oms { tcp("127.0.0.1" port(25224)); };
log { source(src); filter(f_warning_oms); destination(warning_oms); };
###Enabling high volume syslog event collection By default, the OMS Agent for Linux receives events from the syslog daemon over UDP. In cases where a Linux machine is expected to collect a high volume of syslog events, such as when a Linux agent is receiving events from other devices, the configuration should be modified to use TCP transport between the syslog daemon and OMS agent.
To switch from UDP to TCP for syslog:
-
Disable centralized configuration:
sudo /opt/microsoft/omsconfig/Scripts/OMS_MetaConfigHelper.py --disable -
Edit
/etc/opt/microsoft/omsagent/conf/omsagent.d/syslog.conf. Locate the<source>element with:type syslog. Set the protocol_type fromudptotcp.<source> type syslog port 25224 bind 127.0.0.1 #protocol_type udp protocol_type tcp tag oms.syslog </source> -
Modify the /etc/rsyslog.d/95-omsagent.conf file and replace any instances of:
@127.0.0.1:25224with@@127.0.0.1:25224. For more information on controlling which syslog events are collected, reference the Syslog Events section above. -
Restart the omsagent and syslog daemons:
sudo /opt/microsoft/omsagent/bin/service_control restart [<workspace id>] sudo service rsyslog restart -
Confirm that no errors are reported in the omsagent log:
tail /var/opt/microsoft/omsagent/log/omsagent.log
Note: using TCP with rsyslog may require changes to your selinux policy
If you are using selinux, the semanage tool can be used to allow TCP traffic for the port 25224:
sudo semanage port -a -t syslogd_port_t -p tcp 25224
-
If you would like the omsagent to continue to use UDP for local syslog events but listen for remote syslog events with TCP, you can add another `<source>` element to the file using an alternate **port**:
<source>
	  type syslog
	  port 25225
	  bind 0.0.0.0
	  protocol_type tcp
	  tag oms.syslog
</source>
Note: ports 0-1024 are privileged, and require special permissions. As the OMS Agent for Linux runs as the omsagent user trying to allocate a source port of 0 to 1024 results in agent startup failure
Performance metrics to collect are controlled by the configuration in /etc/opt/microsoft/omsagent/conf/omsagent.conf. The appendix to this document details available classes and metrics in this release of the agent.
Each Object (or category) of performance metrics to collect should be defined in the configuration file as a single <source> element. The syntax follows the pattern:
<source>
  type oms_omi
  object_name "Processor"
  instance_regex ".*"
  counter_name_regex ".*"
  interval 30s
</source>
The configurable parameters of this element are:
- Object_name: the object name for the collection. Reference the objects and counters listed in the Appendix of this document
- Instance_regex: a regular expression defining which instances to collect. The value: “.*” specifies all instances. To collect processor metrics for only the _Total instance, you could specify “_Total”. To collect process metrics for only the crond or sshd instances, you could specify: “(crond|sshd)”.
- Counter_name_regex: a regular expression defining which counters (for the object) to collect. Reference the objects and counters listed in the Appendix of this document. To collect all counters for the object, specify: “.*”. To collect only swap space counters for the memory object, you could specify: “.+Swap.+”
- Interval: The frequency at which the object's counters are collected
The default configuration for a performance metric is:
<source>
  type oms_omi
  object_name "Physical Disk"
  instance_regex ".*"
  counter_name_regex ".*"
  interval 5m
</source>

<source>
  type oms_omi
  object_name "Logical Disk"
  instance_regex ".*
  counter_name_regex ".*"
  interval 5m
</source>

<source>
  type oms_omi
  object_name "Processor"
  instance_regex ".*
  counter_name_regex ".*"
  interval 30s
</source>

<source>
  type oms_omi
  object_name "Memory"
  instance_regex ".*"
  counter_name_regex ".*"
  interval 30s
</source>
CollectD is an open source Linux daemon that periodically collects data from applications and system level information. Example applications CollectD can collect metrics from include the Java Virtual Machine (JVM), MySQL Server, Nginx, etc. Current support for CollectD includes version 4.8+.
A full list of available plugins can be found here: https://collectd.org/wiki/index.php/Table_of_Plugins.
OMS Agent for Linux v1.1.0-217+ is required for CollectD metric collection
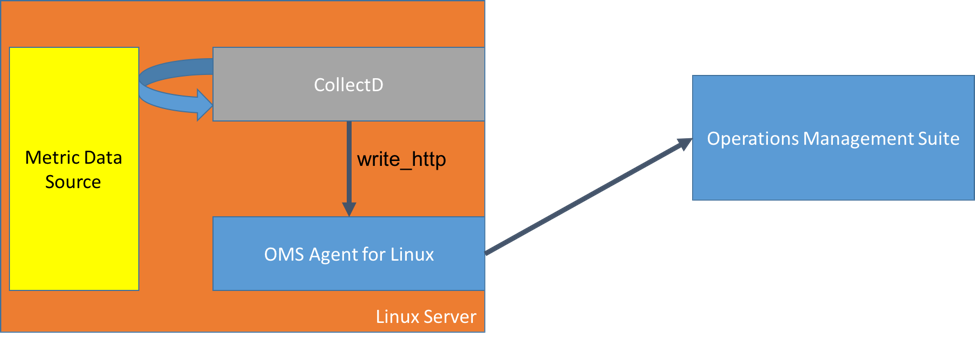
The following CollectD configuration is included in the OMS Agent for Linux to route CollectD data to the OMS Agent for Linux
LoadPlugin write_http

<Plugin write_http>
         <Node "oms">
         URL "127.0.0.1:26000/oms.collectd"
         Format "JSON"
         StoreRates true
         </Node>
</Plugin>
Additionally, if using an versions of collectD before 5.5 use the following configuration instead
LoadPlugin write_http


<Plugin write_http>
       <URL "127.0.0.1:26000/oms.collectd">
        Format "JSON"
         StoreRates true
       </URL>
</Plugin>
This CollectD configuration uses the default write_http plugin to send metric data over port 26000 to OMS Agent for Linux. Note: This port can be configured to another port if needed.
The OMS Agent for Linux also listens on port 26000 for CollectD metrics and then converts them to OMS schema metrics. The following is the OMS Agent for Linux configuration collectd.conf.
<source>
 type http
  port 26000
  bind 127.0.0.1
</source>

<filter oms.collectd>
  type filter_collectd
</filter>
During installation the option --collectd can be used to automatically place the CollectD configuration for versions 5.5+ in /etc/collectd/conf.d/, and enable the OMS Agent for Linux filter.
If OMS Agent for Linux is already installed you can run the following command: /opt/microsoft/omsagent/bin/omsadmin.sh -c to automatically place the CollectD configuration in /etc/collectd/conf.d/, and enable the OMS Agent for Linux filter.
Note: If CollectD is not installed in a default path or is version < 5.5 then these options should not be used, and the files should be placed manually in CollectD configuration directory. Additionally, CollectD must be restarted after installation
To maintain a familiar model between infrastructure metrics already collected by OMS Agent for Linux and the new metrics collected by CollectD the following schema mapping is used:
| CollectD Metric Field | OMS Log Analytic Field |
|---|---|
| host | Computer |
| plugin | None |
| plugin_instance | Instance Name -- if plugin_instance is null then InstanceName="_Total" |
| type | ObjectName |
| type_instance | CounterName -- if type_instance is null then CounterName=blank |
| dsnames[] | CounterName |
| dstypes | None |
| values[] | CounterValue |
Custom JSON Data sources can be routed through the OMS Agent for Linux allowing you to index based off JSON fields. These custom data sources can range from simple scripts returning JSON e.g. curl , or one of FluentD's 300+ plugins. Additionally, custom data sources are analyzed by OMS to determine if the field is a number, string, integer, or boolean allowing for aggregations and additional logic.
OMS Agent for Linux v1.1.0-217+ is required for Custom JSON Data
To bring any JSON data into OMS, the setup required is adding oms.api. before a FluentD tag in an input plugin. Additionally, the following output plugin configuration should be added to the main configuration in /etc/opt/microsoft/omsagent/conf/omsagent.conf or as a seperate configuration file placed in /etc/opt/microsoft/omsagent/conf/omsagent.d/
output plugin for Custom JSON Data
<match oms.api.**>
  type out_oms_api
  log_level info

  buffer_chunk_limit 5m
  buffer_type file
  buffer_path /var/opt/microsoft/omsagent/state/out_oms_api*.buffer
  buffer_queue_limit 10
  flush_interval 20s
  retry_limit 10
  retry_wait 30s
</match>
Example seperate configuration file exec-json.conf for /etc/opt/microsoft/omsagent/conf/omsagent.d/ with FluentD plugin exec and output through Custom JSON output plugin from above.
<source>
  type exec
  command 'curl localhost/json.output'
  format json
  tag oms.api.httpresponse
  run_interval 30s
</source>

<match oms.api.httpresponse>
  type out_oms_api
  log_level info

  buffer_chunk_limit 5m
  buffer_type file
  buffer_path /var/opt/microsoft/omsagent/state/out_oms_api_httpresponse*.buffer
  buffer_queue_limit 10
  flush_interval 20s
  retry_limit 10
  retry_wait 30s
</match>
Once complete, restart the OMS Agent for Linux service: sudo /opt/microsoft/omsagent/bin/service_control restart [<workspace id>] and the data shows up in Log Analytics under Type=<FLUENTD_TAG>_CL.
**Example:**The following custom tag tag oms.api.tomcat shows up as Type=tomcat_CL in Log Analytics
Note: Nested JSON data sources are supported, but are indexed based off of parent field. The following JSON data
{
    "tag": [{
    	"a":"1",
    	"b":"2"
    }]
}
Shows up as the following in Log Analytics search
tag_s : "[{ "a":"1", "b":"2" }]
To collect alerts from a Nagios server, the following configuration changes must be made:
- Grant the user omsagent read access to the Nagios log file (i.e.
/var/log/nagios/nagios.log). Assuming the nagios.log file is owned by the groupnagios, you can add the user omsagent to the nagios group.
sudo usermod -a -G nagios omsagent
- Modify the
omsagent.confconfiguration file (/etc/opt/microsoft/omsagent/conf/omsagent.conf). Ensure the following entries are present and not commented out:
<source>
  type tail
  #Update path to point to your nagios.log
  path /var/log/nagios/nagios.log
  format none
  tag oms.nagios
</source>

<filter oms.nagios>
  type filter_nagios_log
</filter>
- Restart the omsagent daemon
sudo sh /opt/microsoft/omsagent/bin/service_control restart [<workspace id>]
To collect alerts from a Zabbix server, you'll perform similiar steps to those for Nagios above, except you'll need to specify a user and password in clear text. This is not ideal, but we recommend that you create the user and grant permissions to monitor onlu.
An example section of the omsagent.conf configuration file /etc/opt/microsoft/omsagent/conf/omsagent.conf for Zabbix resembles the following:
<source>
  type zabbix_alerts
  run_interval 1m
  tag oms.zabbix
  zabbix_url http://localhost/zabbix/api_jsonrpc.php
  zabbix_username Admin
  zabbix_password zabbix
</source>
The logs for the Operations Management Suite Agent for Linux can be found at:
/var/opt/microsoft/omsagent/log/
The logs for the omsconfig (agent configuration) program can be found at:
/var/opt/microsoft/omsconfig/log/
Logs for the OMI and SCX components (which provide performance metrics data) can be found at:
/var/opt/omi/log/ and /var/opt/microsoft/scx/log
##Log Rotation Configuration##
The log rotate configuration for omsagent can be found at:
/etc/logrotate.d/omsagent
The default settings are
/var/opt/microsoft/omsagent/log/omsagent.log {
    rotate 5
    missingok
    notifempty
    compress
    size 50k
    copytruncate
}
The agent packages can be uninstalled using dpkg or rpm, or by running the bundle .sh file with the --remove argument. Additionally, if you want to completely remove all pieces of the OMS Agent for Linux you can run the bundle .sh file with the --purge arguement.
Debian & Ubuntu:
> sudo dpkg -P omsconfig
> sudo dpkg -P omsagent
> sudo /opt/microsoft/scx/bin/uninstall
CentOS, Oracle Linux, RHEL, and SLES:
> sudo rpm -e omsconfig
> sudo rpm -e omsagent
> sudo /opt/microsoft/scx/bin/uninstall
The Operations Management Suite Agent for Linux shares agent binaries with the System Center Operations Manager agent. Installing the OMS Agent for Linux on a system currently managed by Operations Manager upgrades the OMI and SCX packages on the computer to a newer version. In this preview release, the OMS and System Center 2012 R2 Agents for Linux are compatible. System Center 2012 SP1 and earlier versions are currently not compatible or supported with the OMS Agent for Linux
Note: if the OMS Agent for Linux is installed to a computer that is not currently managed by Operations Manager, and you then wish to manage the computer with Operations Manager, you must modify the OMI configuration prior to discovering the computer. This step is not needed if the Operations Manager agent is installed before the OMS Agent for Linux.
- Edit the file
/etc/opt/omi/conf/omiserver.conf - Ensure that the line beginning with httpsport= defines the port 1270. Such as:
httpsport=1270 - Restart the OMI server:
sudo /opt/omi/bin/service_control restart
-
##Azure Diagnostics For Linux virtual machines running in Azure, additional steps may be required to allow data collection by Azure Diagnostics and Operations Management Suite. Version 2.2 of the Diagnostics Extension for Linux is required for compatibility with the OMS Agent for Linux.
For more information on installing and configuring the Diagnostic Extension for Linux, see this article.
Upgrading the Linux Diagnostics Extension from 2.0 to 2.2 **Azure CLI ** ASM:
 azure vm extension set -u <vm_name> LinuxDiagnostic Microsoft.OSTCExtensions 2.0
 azure vm extension set <vm_name> LinuxDiagnostic Microsoft.OSTCExtensions 2.2 --private-config-path PrivateConfig.json
ARM:
 azure vm extension set -u <resource-group> <vm-name> Microsoft.Insights.VMDiagnosticsSettings Microsoft.OSTCExtensions 2.0
 azure vm extension set <resource-group> <vm-name> LinuxDiagnostic Microsoft.OSTCExtensions 2.2 --private-config-path PrivateConfig.json
Note: These command examples reference a file named PrivateConfig.json. The format of that file should be:
{ "storageAccountName":"the storage account to receive data", "storageAccountKey":"the key of the account" } -
##Sysklog is not supported Either rsyslog or syslog-ng are required to collect syslog messages. The default syslog daemon on version 5 of Red Hat Enterprise Linux, CentOS, and Oracle Linux version (sysklog) is not supported for syslog event collection. To collect syslog data from this version of these distributions, the rsyslog daemon should be installed and configured to replace sysklog. For more information on replacing sysklog with rsyslog, see: http://wiki.rsyslog.com/index.php/Rsyslog_on_CentOS_success_story#Install_the_newly_built_rsyslog_RPM
#Appendices
| Object Name | Counter Name |
|---|---|
| Apache HTTP Server | Busy Workers |
| Apache HTTP Server | Idle Workers |
| Apache HTTP Server | Pct Busy Workers |
| Apache HTTP Server | Total Pct CPU |
| Apache Virtual Host | Errors per Minute - Client |
| Apache Virtual Host | Errors per Minute - Server |
| Apache Virtual Host | KB per Request |
| Apache Virtual Host | Requests KB per Second |
| Apache Virtual Host | Requests per Second |
| Logical Disk | % Free Inodes |
| Logical Disk | % Free Space |
| Logical Disk | % Used Inodes |
| Logical Disk | % Used Space |
| Logical Disk | Disk Read Bytes/sec |
| Logical Disk | Disk Reads/sec |
| Logical Disk | Disk Transfers/sec |
| Logical Disk | Disk Write Bytes/sec |
| Logical Disk | Disk Writes/sec |
| Logical Disk | Free Megabytes |
| Logical Disk | Logical Disk Bytes/sec |
| Memory | % Available Memory |
| Memory | % Available Swap Space |
| Memory | % Used Memory |
| Memory | % Used Swap Space |
| Memory | Available MBytes Memory |
| Memory | Available MBytes Swap |
| Memory | Page Reads/sec |
| Memory | Page Writes/sec |
| Memory | Pages/sec |
| Memory | Used MBytes Swap Space |
| Memory | Used Memory MBytes |
| MySQL Database | Disk Space in Bytes |
| MySQL Database | Tables |
| MySQL Server | Aborted Connection Pct |
| MySQL Server | Connection Use Pct |
| MySQL Server | Disk Space Use in Bytes |
| MySQL Server | Full Table Scan Pct |
| MySQL Server | InnoDB Buffer Pool Hit Pct |
| MySQL Server | InnoDB Buffer Pool Use Pct |
| MySQL Server | InnoDB Buffer Pool Use Pct |
| MySQL Server | Key Cache Hit Pct |
| MySQL Server | Key Cache Use Pct |
| MySQL Server | Key Cache Write Pct |
| MySQL Server | Query Cache Hit Pct |
| MySQL Server | Query Cache Prunes Pct |
| MySQL Server | Query Cache Use Pct |
| MySQL Server | Table Cache Hit Pct |
| MySQL Server | Table Cache Use Pct |
| MySQL Server | Table Lock Contention Pct |
| Network | Total Bytes Transmitted |
| Network | Total Bytes Received |
| Network | Total Bytes |
| Network | Total Packets Transmitted |
| Network | Total Packets Received |
| Network | Total Rx Errors |
| Network | Total Tx Errors |
| Network | Total Collisions |
| Physical Disk | Avg. Disk sec/Read |
| Physical Disk | Avg. Disk sec/Transfer |
| Physical Disk | Avg. Disk sec/Write |
| Physical Disk | Physical Disk Bytes/sec |
| Process | Pct Privileged Time |
| Process | Pct User Time |
| Process | Used Memory kBytes |
| Process | Virtual Shared Memory |
| Processor | % DPC Time |
| Processor | % Idle Time |
| Processor | % Interrupt Time |
| Processor | % IO Wait Time |
| Processor | % Nice Time |
| Processor | % Privileged Time |
| Processor | % Processor Time |
| Processor | % User Time |
| System | Free Physical Memory |
| System | Free Space in Paging Files |
| System | Free Virtual Memory |
| System | Processes |
| System | Size Stored In Paging Files |
| System | Uptime |
| System | Users |
*Note: For Network Statistics the calculation is from start of the omiagent process
##Appendix B: Database Permissions Required for MySQL Performance Counters *Note: To grant permissions to a MySQL monitoring user the granting user must have the ‘GRANT option’ privilege as well as the privilege being granted. *
In order for the MySQL User to return performance data the user will need access to the following queries
SHOW GLOBAL STATUS;
SHOW GLOBAL VARIABLES:
In addition to these queries the MySQL user requires SELECT access to the following default tables: information_schema, mysql. These privileges can be granted by running the following grant commands.
GRANT SELECT ON information_schema.* TO ‘monuser’@’localhost’;
GRANT SELECT ON mysql.* TO ‘monuser’@’localhost’;
##Appendix C: Managing MySQL monitoring credentials in the authentication file
Configuring the MySQL OMI Provider The MySQL OMI provider requires a preconfigured MySQL user and installed MySQL client libraries in order to query the performance/health information from the MySQL instance.
MySQL OMI Authentication File MySQL OMI provider uses an authentication file to determine what bind-address and port the MySQL instance is listening on and what credentials to use to gather metrics. During installation the MySQL OMI provider will scan MySQL my.cnf configuration files (default locations) for bind-address and port and partially set the MySQL OMI authentication file.
The following options are available to complete monitoring of a MySQL server instance:
- Add a pre generated MySQL OMI authentication file into the correct directory a. Refer to Authentication File Format and Authentication File location below
- Use the MySQL OMI authentication file program to configure a new MySQL authentication file a. Refer to MySQL OMI Authentication File Program below
Authentication File Format The MySQL OMI authentication file is a text file that contains information about the Port, Bind-Address, MySQL username, and a Base64 encoded password. The MySQL OMI authentication file only grants privileges for read/write to the Linux user that generated it.
[Port]=[Bind-Address], [username], [Base64 encoded Password]
(Port)=(Bind-Address), (username), (Base64 encoded Password)
(Port)=(Bind-Address), (username), (Base64 encoded Password)
AutoUpdate=[true|false]
A default MySQL OMI authentication file contains a default instance and a port number depending on what information is available and parsed from the found MySQL configuration file.
The default instance is a means to make managing multiple MySQL instances on one Linux host easier, and is denoted by the instance with port 0. All added instances will inherit properties set from the default instance. For example, if MySQL instance listening on port ‘3308’ is added, the default instance’s bind-address, username, and Base64 encoded password will be used to try and monitor the instance listening on 3308. If the instance on 3308 is binded to another address and uses the same MySQL username and password pair only the re specification of the bind-address is needed and the other properties will be inherited.
Examples of the authentication file can be found below:
Default instance and instance with port 3308:
0=127.0.0.1, myuser, cnBwdA==
3308=, ,
AutoUpdate=true
Default instance and instance with port 3308 + different Base 64 encoded password
0=127.0.0.1, myuser, cnBwdA==
3308=127.0.1.1, ,
AutoUpdate=true
| Property | Description |
|---|---|
| Port | Port represents the current port the MySQL instance is listening on. The port 0 implies that the properties following are used for default instance. |
| Bind-Address | the Bind Address is the current MySQL bind-address |
| username | This the username of the MySQL user you wish to use to monitor the MySQL server instance. |
| Base64 encoded Password | This is the password of the MySQL monitoring user encoded in Base64. |
| AutoUpdate | When the MySQL OMI Provider is upgraded the provider will rescan for changes in the my.cnf file and overwrite the MySQL OMI Authentication file. Set this flag to true or false depending on required updates to the MySQL OMI authentication file. |