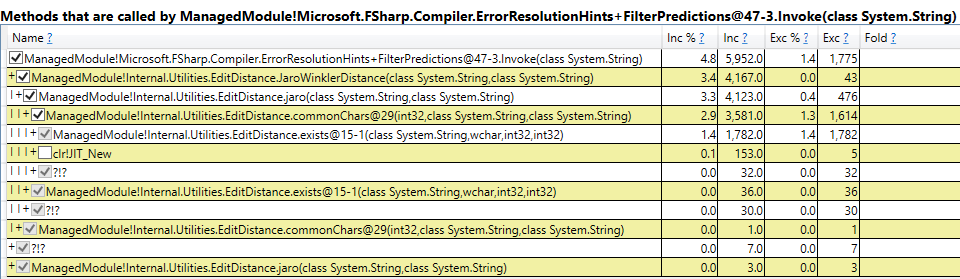
JaroWinkler string distance algorithm allocates 1.11 GB and spends 4.8% of CPU time generating suggestions that are rarely used #6044
Comments
|
// cc @forki @Rickasaurus since you all may know more about how EditDistance works. Based on this issue, I will try to make a benchmark on |
|
The root of this is two competing use cases:
In both cases we churn through all known symbols and generate suggestions, but in the former case, this work is not useful and evidently causes the IDE to do a lot of work when it shouldn't. However, the latter case is useful, and the suggestions we get from this feature are also nice. A quick fix would be to not generate these suggestions. However, that regresses the second scenario. What we actually need is a way to understand when we're in one of the following contexts:
In this case, we want to do this work. However, routine typing in the editor should not churn through all identifier strings and calculate distances. |
|
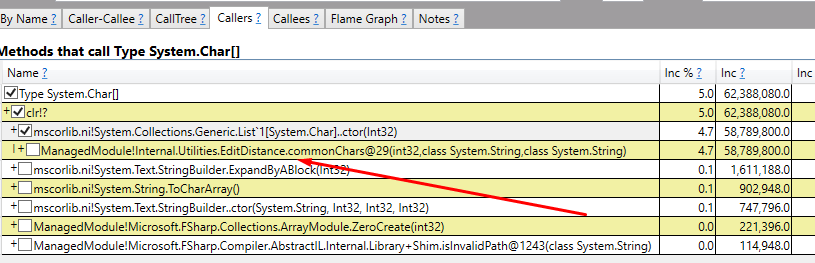
Full sample: Callers tree on System.String:
215 MB string allocations just from Callee tree on
1.11 GB of allocations, which is 10.9% of total allocations in the sample. We need to put this feature behind a flag until we come up with something better. This is an insane amount of allocations. |


|
Potential quick change:
Unfortunately, this also means the code fix is off by default. We are not architecturally set up to have it be on for the code fix, since doing so would mean that it would also be turned on any time you're typing an get an error. We'd need a larger architectural change (e.g., moving this and related work out of process) to have regular typing not incur this work, but a lightbulb fix go and do the calculation. |
|
So it's only an issue while typing?
What's the concrete repro?
Am Fr., 21. Dez. 2018, 02:43 hat Phillip Carter <notifications@github.com>
geschrieben:
… Potential quick change:
- Define a flag that effectively means, "I am in an editor with F#
tooling"
- Have that flag wired to an off-by-default setting in VS at the
language service integration layer (other editors can also wire up their
own)
- Have the flag set to true by default in the compiler so dotnet build
isn't regressed
Unfortunately, this also means the code fix is off by default. We are not
architecturally set up to have it be on for the code fix, since doing so
would mean that it would also be turned on any time you're typing an get an
error. We'd need a larger architectural change (e.g., moving this and
related work out of process) to have regular typing not incur this work,
but a lightbulb fix go and do the calculation.
—
You are receiving this because you were mentioned.
Reply to this email directly, view it on GitHub
<#6044 (comment)>,
or mute the thread
<https://github.com/notifications/unsubscribe-auth/AADgNGx2EpjwNQDOUsxZUI-CBcoGS-pSks5u7DzRgaJpZM4ZdD9U>
.
|
|
Yes, this is with typing. If you do it slowly enough, or at least such that there are some compile errors due to not being "done", it will trigger. I noticed this while goofing around a bit with caches in What's nasty here is that in only 90 seconds, we already triggered a 4 second gen 2 collection. That's huge, especially considering it's in a single file. I'm not sure how to track if anything from this made it into gen2, but when something is representing nearly 11% of memory pressure it's very significant. We didn't see this before because other massive allocations from continually allocating strings that represent the source file were the hot spot, but with #6001 fixing that, we're now seeing this as a hot spot in the scenario I described. |
|
Ok I see. That's really bad. On the other hand this feature is one of the
most useful during development, so just turning it off by default would be
extremely sad.
Here are a few things that we can try:
* optimize the algo to allocate less
* use simpler algo (tbh predictions are almost always giving one element -
and it's the correct one) - this means we can probably find it without all
the ceremony
* we could limit the suggestions to the first 5 name res errors in every
run. Which means if you process your compiler errors from top to bottom
then you will always have suggestions for the current error - but you would
not have it everywhere in all 5000 errors that you might see
But of course the most important thing is to find a way to device if the
user is still typing
Am Fr., 21. Dez. 2018, 07:11 hat Phillip Carter <notifications@github.com>
geschrieben:
… Yes, this is with typing. If you do it slowly enough, or at least such
that there are some compile errors due to not being "done", it will
trigger. I noticed this while goofing around a bit with caches in
service.fs. There's no concrete repro beyond noticing the slowdown and
gathering a trace. Just the nature of lots of these IDE perf problems 🙂
What's nasty here is that in only 90 seconds, we already triggered a 4
second gen 2 collection. That's huge, especially considering it's in a
single file. I'm not sure how to track if anything from this made it into
gen2, but when something is representing nearly 11% of memory pressure it's
very significant. We didn't see this before because other massive
allocations from continually allocating strings that represent the source
file were the hot spot, but with #6001
<#6001> fixing that, we're
now seeing this as a hot spot in the scenario I described.
—
You are receiving this because you were mentioned.
Reply to this email directly, view it on GitHub
<#6044 (comment)>,
or mute the thread
<https://github.com/notifications/unsubscribe-auth/AADgNHH21BJPAGXAcs_JmEZ5aBgQNL_3ks5u7HuogaJpZM4ZdD9U>
.
|
|
there is also another idea in #6049 - we don't need to call this whole thing on small identifiers. this may be a lot during typing. |
|
Yes, finding a way to not turn it off is definitely ideal. If we can't get something in place I'll likely advocate that we turn it off in VS by default. I do think it's a bit less severe in VS because completion will generally work, and the message in the error list window is a bit hard to read, making it something people may lean a little less on. But that would mean sacrificing the nicer message in the tooltip and the code fix suggestion, which are obviously benefits. The allocation and CPU hotspot is in |
|
BTW thanks for engaging on this already - let's figure out the best way forward here 🙂 |
|
question: the current implementation is using a resizearray which I assume allocates on the heap. We only need the info locally in the jaro function. Would changing it to |
@forki, even though That is not to say that |
|
Just to confirm that this should definitely be impactful. I took another trace with Memory usage: CPU time: If benchmarking yields improvements in memory/CPU time I think we can definitely consider #6050 as having solved the problem and close this issue. I still want to take a look at #6049, since it can basically keep the routine from running at all in a number of scenarios. We'll have to think that one through a bit, since there are definitely cases where you'd want a suggestion when an identifier is less than 5 chars long. Perhaps we can take the average length of all identifiers and use that as a threshold? |


|
Let's definitely do #6049 but I will set threshold to 4. It just doesn't really make sense below that. |
This was found by:
service.fsGC Rollup
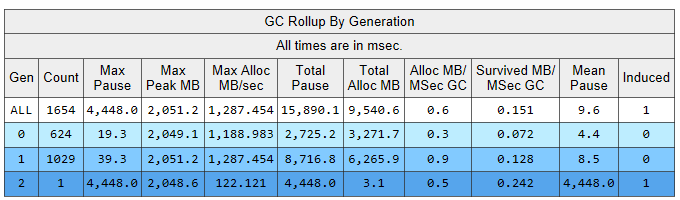
Using a 50 second sample of the full trace:
Allocations
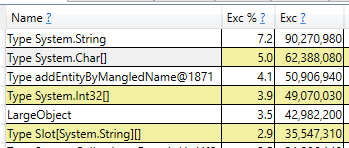
System.Char[] allocations
CPU time
There are two problems at play here:
char[]s and generally does a lot of work: https://github.com/Microsoft/visualfsharp/blob/master/src/utils/EditDistance.fs#L29Taking a brief look, it doesn't seem trivial to make this faster or allocate less. It's also not clear how we could generate useful suggestions for people if we cannot scan all known identifiers.
That said, we should find something to do here. It comes as a result of typing in the IDE. Because this is done a lot (duh!), especially for slower typers, improving this would be useful.
The text was updated successfully, but these errors were encountered: