Skip to content
New issue

Have a question about this project? Sign up for a free GitHub account to open an issue and contact its maintainers and the community.

By clicking “Sign up for GitHub”, you agree to our terms of service and privacy statement. We’ll occasionally send you account related emails.

Already on GitHub? Sign in to your account

EPIPE write failure while debugging after upgrading to 1.49 #106484

Closed
szul opened this issue Sep 11, 2020 · 18 comments
Closed

EPIPE write failure while debugging after upgrading to 1.49 #106484

szul opened this issue Sep 11, 2020 · 18 comments
Assignees
Labels
bug Issue identified by VS Code Team member as probable bug candidate Issue identified as probable candidate for fixing in the next release debug Debug viewlet, configurations, breakpoints, adapter issues

Comments

@szul
Copy link

szul commented Sep 11, 2020

  • VSCode Version: 1.49
  • OS Version: Pop OS 20.04 (Ubuntu)

Steps to Reproduce:

  1. Upgrade to 1.49
  2. Trying to debug

Does this issue occur when all extensions are disabled?: Yes

After upgrading to 1.49, both a Linux Pop OS machine and a Mac OSX machine on my team started having the following error: When attempting to launch the debugger, we would receive a failure to write EPIPE error. The error triggers in the tslib package. In our particular situation, it starts with an attempt to createConnection() with the TypeORM package (which uses node-mssql and tedious). Stepping into that breakpoint trigger the tslib failure and the EPIPE message.

Rolling back to VSCode 1.48 eliminated the problem.

@weinand
Copy link
Contributor

weinand commented Sep 11, 2020

What debugger are you using?

@weinand weinand added debug Debug viewlet, configurations, breakpoints, adapter issues info-needed Issue requires more information from poster labels Sep 11, 2020
@szul
Copy link
Author

szul commented Sep 11, 2020

The built-in debugger with Visual Studio Code. This occurs at project start-up when clicking the debug icon.

Here is an entry from the launch.json:

{
        "type": "node",
        "request": "launch",
        "name": "Launch LMS Program",
        "program": "${workspaceFolder}/apps/lms/dist/index.js",
        "preLaunchTask": "build-lms",
        "outFiles": [
            "${workspaceFolder}/apps/lms/dist/**/*.js"
        ],
        "envFile": "${workspaceFolder}/apps/lms/.env"
}

@weinand
Copy link
Contributor

weinand commented Sep 11, 2020

And the problem reproduces after disabling all extensions?

@szul
Copy link
Author

szul commented Sep 11, 2020

@weinand Yes on both the Debian version and the Mac OSX version of Visual Studio Code 1.49. The only thing that fixed it was rolling back to 1.48 (which fixed it on both computers).

@weinand
Copy link
Contributor

weinand commented Sep 11, 2020

See the solution here #106484 (comment)

Previous comment

Does it make a difference if you:

  • comment out the "preLaunchTask"?
  • add "debug.javascript.usePreview": false as a user setting?

(only one at a time, not both)

@szul
Copy link
Author

szul commented Sep 11, 2020

@weinand I can give this a shot this weekend. Right now I need the downgraded version for work-related tasks, so I'll have to carve out some time to try it.

@nico93f
Copy link

nico93f commented Sep 11, 2020

Does it make a difference if you:

  • comment out the "preLaunchTask"?
  • add "debug.javascript.usePreview": false as a user setting?

(only one at a time, not both)

Same problem,

I dont have preLaunchTask and the usePreview: false didn't work

@connor4312
Copy link
Member

Can you also try adding nodeVersionHint: 10 to your launch.json?

@nico93f
Copy link

nico93f commented Sep 11, 2020

Can you also try adding nodeVersionHint: 10 to your launch.json?

nodeVersionHint is not recognized as a valid config key, you mean here?

image

@connor4312
Copy link
Member

connor4312 commented Sep 11, 2020

Yep, there. (It'll be recognized if you change type to pwa-node).

Also, @nico93f what kind of program are you running? I saw this yesterday in Next.js which was caused by a bug that was fixed in recent versions... wondering if other tools are running into a similar problem.

@nico93f
Copy link

nico93f commented Sep 11, 2020

Oh btw, it didn't work 😛

@connor4312
Copy link
Member

connor4312 commented Sep 11, 2020

Looks like the EPIPE my Next.js is coming from Node's inspector internals, triggered originally from jest-worker. Continuing to investigate.

Can you collecct trace logs using these instructions?

If you're able to, add "trace": true to your launch.json and reproduce the issue. The location of the log file on your disk will be written to the Debug Console. Share that with us.

⚠️ This log file will not contain source code, but will contain file paths. You can drop it into https://microsoft.github.io/vscode-pwa-analyzer/index.html to see what it contains. If you'd rather not share the log publicly, you can email it to connor@xbox.com

@maximedupre
Copy link

Actually "debug.javascript.usePreview": false does resolve the problem on my side.

@connor4312
Copy link
Member

It should, since the old debugger doesn't know how to debug child processes (which is where the one repro case I have fails).

Are you able to collect a trace log @maximedupre?

@maximedupre
Copy link

@connor4312 Just sent the trace log to your email address

@connor4312
Copy link
Member

connor4312 commented Sep 11, 2020

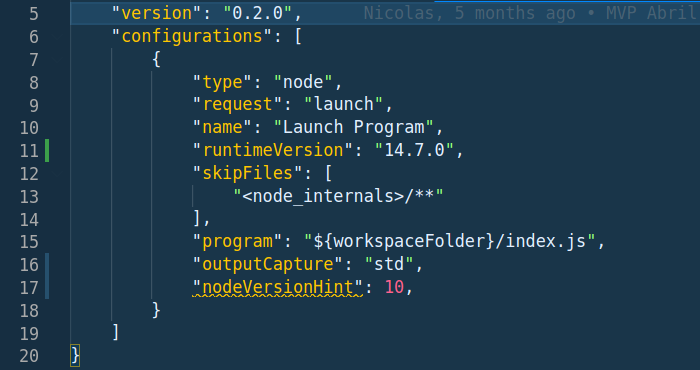
I think I found the issue! Please try adding "outputCapture": "std", in your launch.json as a workaround (may need to change type to pwa-node for it to be seen as valid).

This fixes the issue for me; let me know if it does the same for you.

@connor4312 connor4312 added bug Issue identified by VS Code Team member as probable bug candidate Issue identified as probable candidate for fixing in the next release and removed info-needed Issue requires more information from poster labels Sep 11, 2020
@connor4312 connor4312 added this to the August 2020 Recovery milestone Sep 11, 2020
@maximedupre
Copy link

Yep that fixes the issue! Didn't need to change to "type": "pwa-node".

@connor4312
Copy link
Member

Awesome, thank you for confirming. I will put in a fix for the recovery release.

connor4312 added a commit to microsoft/vscode-js-debug that referenced this issue Sep 11, 2020
This was intended to destroy a pipe reader, but that reader was removed
at some point and this code was left in there. Interestingly it does
not seem to cause an issue for most simple program, so I didn't catch
this, but causes 'random' failures later on.

Fixes microsoft/vscode#106484
connor4312 added a commit that referenced this issue Sep 11, 2020
apparebit added a commit to apparebit/siteforge that referenced this issue Sep 14, 2020
* Make debugger work in VS Code 1.49 by adding outputCapture workaround [microsoft/vscode#106484 (comment)]
* Elide node_modules from stack traces by default
* Remove command line flag that's enabled by default.
@github-actions github-actions bot locked and limited conversation to collaborators Oct 26, 2020
Sign up for free to subscribe to this conversation on GitHub. Already have an account? Sign in.
Labels
bug Issue identified by VS Code Team member as probable bug candidate Issue identified as probable candidate for fixing in the next release debug Debug viewlet, configurations, breakpoints, adapter issues
Projects
None yet
Development

No branches or pull requests

6 participants