Skip to content
New issue

Have a question about this project? Sign up for a free GitHub account to open an issue and contact its maintainers and the community.

By clicking “Sign up for GitHub”, you agree to our terms of service and privacy statement. We’ll occasionally send you account related emails.

Already on GitHub? Sign in to your account

debugger stopped at bootstrap.js #34020

Closed
haolly opened this issue Sep 8, 2017 · 12 comments
Closed

debugger stopped at bootstrap.js #34020

haolly opened this issue Sep 8, 2017 · 12 comments
Assignees
Labels
bug Issue identified by VS Code Team member as probable bug debug Debug viewlet, configurations, breakpoints, adapter issues verified Verification succeeded

Comments

@haolly
Copy link

haolly commented Sep 8, 2017

  • VSCode Version: 1.16.0
  • OS Version: win10

Steps to Reproduce:

  1. Follow instruction https://code.visualstudio.com/docs/extensions/yocode
  2. F5

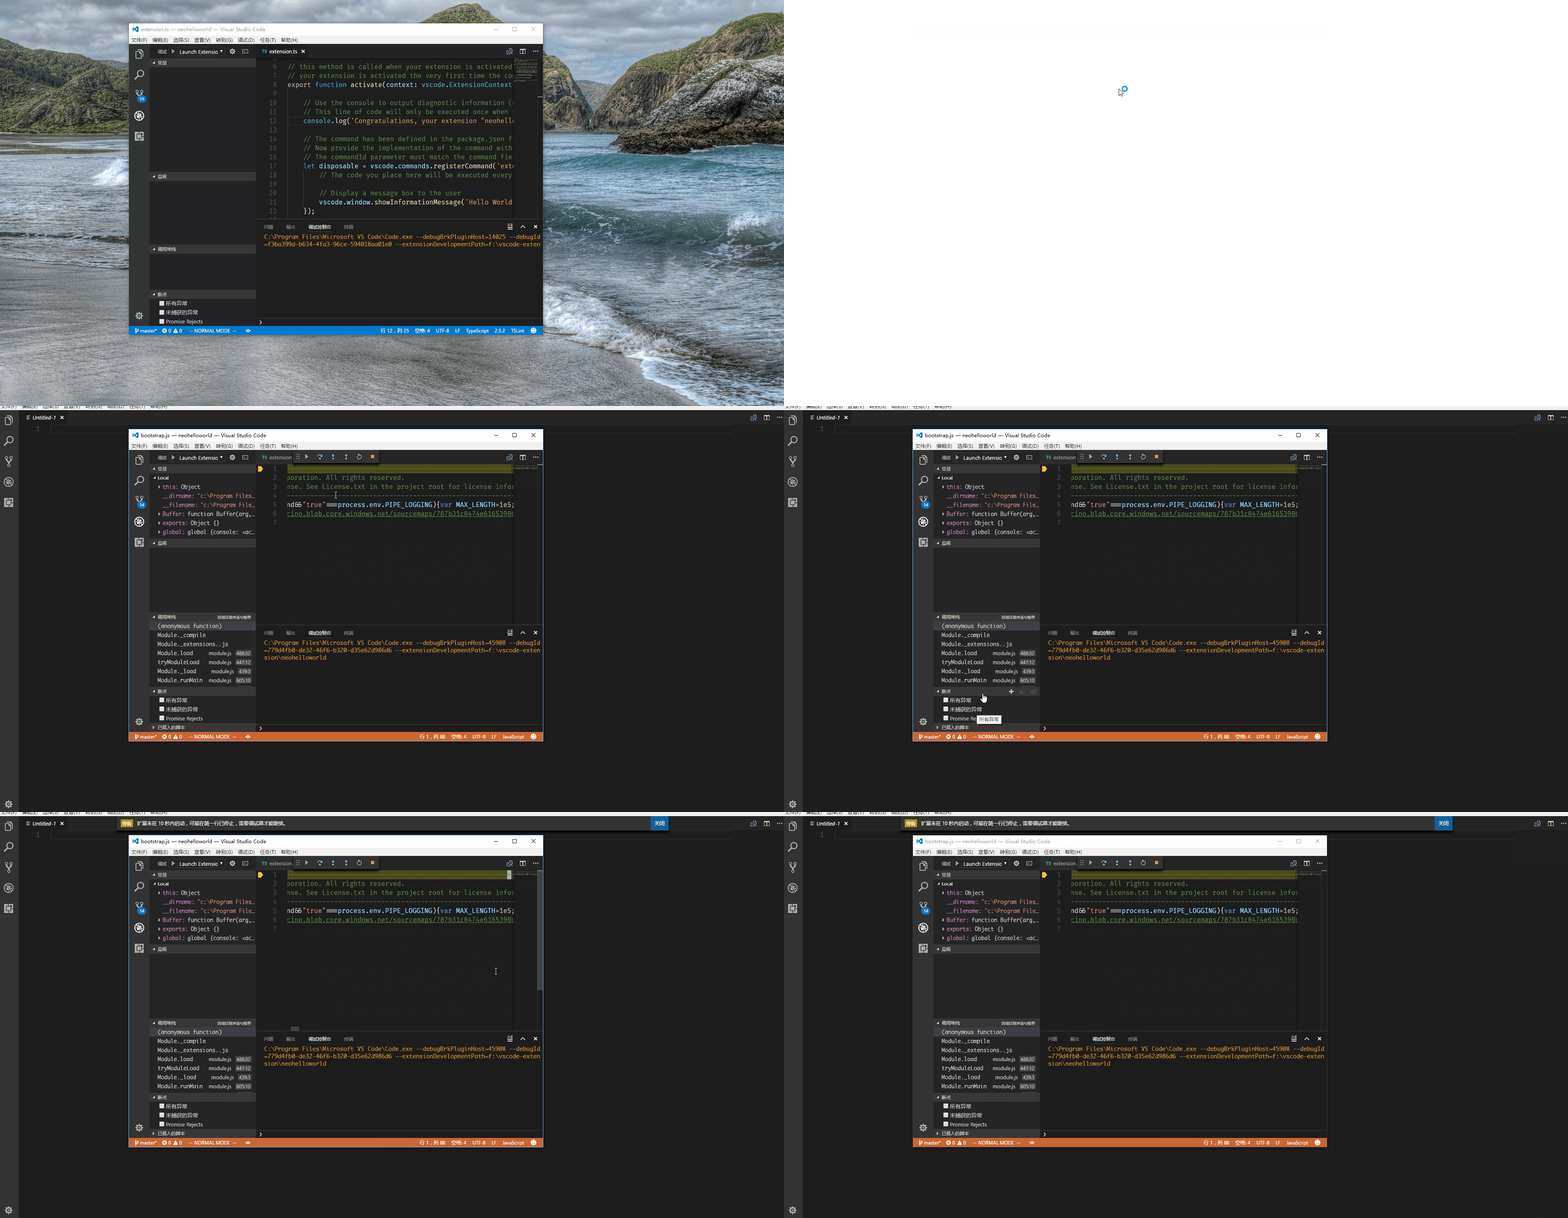
debugger stopped at bootstrap.js

Reproduces without extensions: Yes

@vscodebot vscodebot bot added the new release label Sep 8, 2017
@vscodebot vscodebot bot added the debug Debug viewlet, configurations, breakpoints, adapter issues label Sep 8, 2017
@haolly haolly changed the title debugger stoped at bootstrap.js debugger stopped at bootstrap.js Sep 8, 2017
@isidorn
Copy link
Contributor

isidorn commented Sep 8, 2017

Uncheck the All Exceptions checkbox in the breakpoints pane in debug.
If that still does not work please provide more details. Like a video or picture would help

@isidorn isidorn added info-needed Issue requires more information from poster and removed new release labels Sep 8, 2017
@haolly
Copy link
Author

haolly commented Sep 9, 2017

fasdfaf
@isidorn This only happen when I press F5

@yuyat
Copy link

yuyat commented Sep 11, 2017

+1

@isidorn
Copy link
Contributor

isidorn commented Sep 12, 2017

The stop on excpetion is coming from the node2 debug adapter, forwaring to @roblourens
fyi @weinand

@isidorn isidorn assigned roblourens and unassigned isidorn Sep 12, 2017
@isidorn isidorn removed the info-needed Issue requires more information from poster label Sep 12, 2017
@roblourens
Copy link
Member

Maybe it took too long to launch, and thought it needed to stop on entry.

Does it happen 100% of the time?

@bhughes339
Copy link

bhughes339 commented Sep 16, 2017

@roblourens This is happening for me as well, and it doesn't happen 100% of the time. I'd say probably 90% of the time when I debug (a vscode extension in my case) the bootstrap.js breakpoint fires. It seems this is the relevant code from module.js in node_internals, retrieved from the call stack:

if (process._debugWaitConnect && process._eval == null) {
  if (!resolvedArgv) {
    // we enter the repl if we're not given a filename argument.
    if (process.argv[1]) {
      resolvedArgv = Module._resolveFilename(process.argv[1], null);
    } else {
      resolvedArgv = 'repl';
    }
  }
  // Set breakpoint on module start
  if (filename === resolvedArgv) {
    delete process._debugWaitConnect;
    const Debug = vm.runInDebugContext('Debug');
    Debug.setBreakPoint(compiledWrapper, 0, 0);
  }
}

@roblourens
Copy link
Member

Yeah, we expect it to break there, then we set breakpoints and continue. But if it takes a really long time to start up, then we stop waiting for that break event.

Can you set "trace": true in your launch config? It will create a log file and write the path in the debug console. Then upload that log file here. Thanks!

@bhughes339
Copy link

vscode-node-debug2.txt

Looks like line 84 is when it breaks on bootstrap.js. I halted the debug after reaching the breakpoint.

@roblourens
Copy link
Member

Thanks for the log! I think I found it although I couldn't repro... please try it in the Insiders build tomorrow.

@roblourens roblourens added the bug Issue identified by VS Code Team member as probable bug label Sep 19, 2017
@roblourens roblourens added this to the September 2017 milestone Sep 19, 2017
@bhughes339
Copy link

bhughes339 commented Sep 20, 2017

Thanks @roblourens. I tried today's Insiders build (1.17.0-1505884649) and I'm still having the issue. Here's my tracelog:

vscode-node-debug2.txt

For the record, I debugged the exact same extension on a Win10 machine with identical settings, and I was unable to reproduce the issue.

@roblourens
Copy link
Member

One more update, try again with the next build :)

@bhughes339
Copy link

Looks like this issue is resolved in today's Insiders build, at least for me. Thanks again @roblourens!

@weinand weinand added the verified Verification succeeded label Sep 29, 2017
@vscodebot vscodebot bot locked and limited conversation to collaborators Nov 17, 2017
Sign up for free to subscribe to this conversation on GitHub. Already have an account? Sign in.
Labels
bug Issue identified by VS Code Team member as probable bug debug Debug viewlet, configurations, breakpoints, adapter issues verified Verification succeeded
Projects
None yet
Development

No branches or pull requests

6 participants