Skip to content
New issue

Have a question about this project? Sign up for a free GitHub account to open an issue and contact its maintainers and the community.

By clicking “Sign up for GitHub”, you agree to our terms of service and privacy statement. We’ll occasionally send you account related emails.

Already on GitHub? Sign in to your account

"type": "node" - The debug type is not recognized. #51572

Closed
zenVentzi opened this issue Jun 11, 2018 · 21 comments
Closed

"type": "node" - The debug type is not recognized. #51572

zenVentzi opened this issue Jun 11, 2018 · 21 comments
Assignees
Labels
*as-designed Described behavior is as designed debug Debug viewlet, configurations, breakpoints, adapter issues

Comments

@zenVentzi
Copy link

The debug type is not recognized. Make sure you've got a corresponding debug extension installed and that it is enabled.

vscode v. 1.23.1
node v. 7.9.0
windows 10

Node Debug build in extension is enabled. Restarted vscode multiple times to no avail. It used to work just up until yesterday, not sure what much has changed to cause that "not recognized" warning. Also, it doesn't appear when clicking the Add Configuration... button.

@weinand weinand added debug Debug viewlet, configurations, breakpoints, adapter issues info-needed Issue requires more information from poster labels Jun 11, 2018
@weinand
Copy link
Contributor

weinand commented Jun 11, 2018

@zenVentzi how does your debug configuration (launch.json) look like?
Does this problem occur if you disable all extensions?

It don't understand what you mean by "Node Debug build in extension is enabled"

@erihanse
Copy link

Same problem here. The Node Debug extension seems to be broken.

@weinand
Copy link
Contributor

weinand commented Jun 11, 2018

@erihanse please provide reproducible steps.
how does your debug configuration (launch.json) look like?
Does this problem occur if you disable all extensions?

Please note that the VS Code 1.23.1 is out since beginning of May and there have been no reports of this issue since.
So if you see this problem recently try to find what has changed in your setup: e.g. node version updated, extension added or updated, etc.

@erihanse
Copy link

I was following these steps: https://code.visualstudio.com/docs/nodejs/nodejs-tutorial

When I came to the point where I was starting to debug (Debugging Hello World), a launch.json was created with following content:

{
    // Use IntelliSense to learn about possible attributes.
    // Hover to view descriptions of existing attributes.
    // For more information, visit: https://go.microsoft.com/fwlink/?linkid=830387
    "version": "0.2.0",
    "configurations": [
        {
            "type": "chrome",
            "request": "launch",
            "name": "Launch Chrome against localhost",
            "url": "http://localhost:8080",
            "webRoot": "${workspaceFolder}"
        }
    ]
}

I wasn't prompted for what environment to use for debugging (like python, java or Node.js).
When trying to paste the configuration,

{
    "version": "0.2.0",
    "configurations": [
        {
            "type": "node",
            "request": "launch",
            "name": "Launch Program",
            "program": "${file}"
        }
    ]
}

a green squiggly line is underneath "node", saying
"The debug type is not recognized. Make sure that you have a corresponding debug extension installed and that it is enabled."

@erihanse
Copy link

Also, the extension says "Reload" no matter how many times I try to press reload.
image

@weinand
Copy link
Contributor

weinand commented Jun 11, 2018

@erihanse It would be helpful if you could add a screenshot showing the VS Code window with the error squiggly in the debug configuration. Thanks!

@erihanse
Copy link

Here you go :)
image

@weinand
Copy link
Contributor

weinand commented Jun 11, 2018

Hmm, this really looks like a missing node-debug extension.

What extensions do you have installed?
Just open the extension viewlet and select "Show installed extensions" from the menu.

Paste the result here, like this:
2018-06-12_00-19-25

@weinand weinand closed this as completed Jun 11, 2018
@weinand weinand reopened this Jun 11, 2018
@erihanse
Copy link

There are quite many, they don't all fit on the same screen. Will this output do?

Extension | Author (truncated) | Version
-- | -- | --
vscode-python-docstring | aza | 0.0.5
altervista-thesaurus | bru | 0.1.0
vscode-eslint | dba | 1.4.12
xml | Dot | 2.2.0
es7-react-js-snippets | dsz | 1.8.1
gitlens | eam | 8.3.5
prettier-vscode | esb | 1.5.0
gc-excelviewer | Gra | 2.0.21
word-count | hyp | 0.1.1
latex-workshop | Jam | 5.5.1
docthis | joe | 0.7.1
node-module-intellisense | lei | 1.5.0
mssql | ms- | 1.3.1
python | ms- | 2018.5.0
csharp | ms- | 1.15.2
Go | ms- | 0.6.82
node-debug2 | ms- | 1.18.4
wordcount | ms- | 0.1.0
debugger-for-chrome | msj | 4.6.0
vscode-docker | Pet | 0.0.27
java | red | 0.26.0
surrounding | sif | 1.4.0
vscode-hexdump | sle | 1.6.0
code-spell-checker | str | 1.6.10
python | tht | 0.2.3
vscode-java-debug | vsc | 0.9.0
vscode-java-pack | vsc | 0.3.0
vscode-java-test | vsc | 0.6.1
vscode-maven | vsc | 0.9.0
vim | vsc | 0.12.0
vscode-todo-highlight | way | 0.5.12

@weinand
Copy link
Contributor

weinand commented Jun 11, 2018

The "node-debug2" looks outdated: 1.18.4 instead of 1.23.x.
"node-debug2" is built-into VS Code and there should be no way to install it.
Where did you get it from?

Try to remove it from VS Code.

If the problem persist, try to disable all extensions.
You can use the "Disable all Installed Extensions" for this.

@erihanse
Copy link

erihanse commented Jun 11, 2018

Yeah, well it says "reload" on the extension.
image

Do I have to reinstall vs code to fix this?
I tried debugging with all extensions off, it didn't work (same thing happened).

@weinand
Copy link
Contributor

weinand commented Jun 11, 2018

Before reinstalling try to remove the bogus node-debug2 extension from your extension folder.

  • shut down VS Code
  • there should be a "ms-vscode.node-debug-1.18.4" in ".vscode/extensions" in your user directory. Remove "ms-vscode.node-debug-1.18.4".
  • launch VS Code and try again

@erihanse
Copy link

Okay, now the version got bumped atleast, but the same error is there.
image

I see there is a CI build job which is failing for Windows, can that be the case? That's what I initially meant by the extension was "broke".

@weinand
Copy link
Contributor

weinand commented Jun 11, 2018

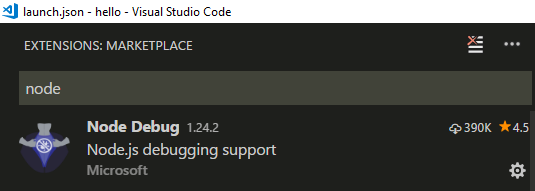
@erihanse the two last screenshots show the extensions available on the Marketplace, not what you have loaded on your system or inside VS Code. So the version numbers you are seeing are out of your control.

If you want to see what is built-into VS Code or what you have installed on top of it, please use the queries from the extension menu:

2018-06-12_01-29-51

@weinand
Copy link
Contributor

weinand commented Jun 11, 2018

BTW, what version of VS Code are you using?
I assume 1.23.1, since that's the version this bug was filed against.

@erihanse
Copy link

Oh okay, think my memory got mixed up. I'm running 1.24.0 as of today. Haven't really done any development with the extension for half a year, so all I can say is that it worked then.

@erihanse
Copy link

I tried uninstalling and installing again, to no avail.

@zenVentzi
Copy link
Author

Please excuse me for my late reply! I got it fixed though. It seems that there are 2 node debug extensions. Node Debug and Node Debug (legacy). The problem was that the (legacy) node debug extension was disabled.

How I fixed it:

  1. Find Node Debug (legacy)
  2. Enable and reload vscode

@weinand
Copy link
Contributor

weinand commented Jun 12, 2018

Oh, that explains it.
"Node Debug (legacy)" is important because it delegates to "Node Debug" for Node.js versions >= 8.0.
Without "Node Debug (legacy)" node debugging is basically disabled because nobody will delegate.

@weinand weinand closed this as completed Jun 12, 2018
@weinand weinand added *as-designed Described behavior is as designed and removed info-needed Issue requires more information from poster labels Jun 12, 2018
@brokenthorn
Copy link

brokenthorn commented Jul 5, 2018

How is this closed? I'm still experiencing the same symptoms with newer VSCode. Node Debug (legacy) is disabled from factory. If it's integral to the node debugging facilities in VSCode, why disable it from the factory?

@weinand
Copy link
Contributor

weinand commented Jul 5, 2018

@brokenthorn No, "Node Debug (legacy)" is not disabled from factory.
If it is disabled for you, then it was disabled by accident.
The fix is to enable it.

@vscodebot vscodebot bot locked and limited conversation to collaborators Jul 27, 2018
Sign up for free to subscribe to this conversation on GitHub. Already have an account? Sign in.
Labels
*as-designed Described behavior is as designed debug Debug viewlet, configurations, breakpoints, adapter issues
Projects
None yet
Development

No branches or pull requests

4 participants