Using the DryadLINQ job browser
The DryadLINQ job browser is a graphical user interface which provides a unified view of a large part of the distributed state of a DryadLINQ job. In this document we provide a brief overview of the main capabilities of the DryadLINQ job browser.
DryadLINQ is a compiler and runtime designed to allow users to run .Net programs on large computer clusters. The input language of DryadLINQ is .Net 4.5 or later. DryadLINQ compiles some .Net LINQ constructs into distributed execution plans, and uses the Dryad distributed runtime to execute these plans on a computer cluster reliably. Dryad runs on a variety of environments; in this manual we discuss the version of Dryad that runs on top of HDInsight, which in turns runs on top of Hadoop, which runs on top of Azure. An introduction to Dryad, LINQ, DryadLINQ, Azure and HDInsight is not in the scope of this manual. Some pointers can be found at the MSR SVC big data web page.
LINQ is essentially a language of operators that compute on collections of values, reminiscent of the relational algebra (SQL), and Lisp. A chain of LINQ operators is a LINQ query. Each LINQ query is translated by DryadLINQ into a Dryad job plan, which is then executed by Dryad on the cluster. A Dryad job is always a directed acyclic graph: the nodes of the graph (also called vertices) are processes that run independently on different machines. The edges of the graph (also called channels) are communication channels that move data between the vertices. While conceptually the user writes a single program that operates on collections, at runtime the program is executed using multiple machines, and on collections that are partitioned and stored on multiple machines. While DryadLINQ does a very good job of providing the illusion that the distributed computation occurs on a single machine, under some circumstances the single-machine abstraction breaks down. This happens especially when the application has (correctness or performance) bugs. The user of DryadLINQ is faced with the task of understanding the behavior of an application that spans multiple machines.
To start the job/cluster browser the user has to invoke the provided executable jobBrowser.exe While running the job browser a console window is shows the detailed log messages generated by the job browser.
The cluster browser is used to connect to a cluster and to retrieve the list of running, or recently run jobs.
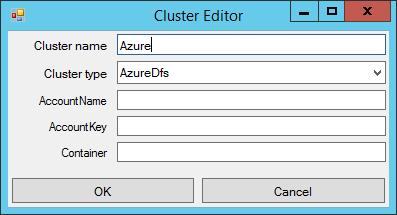
Prior to browsing jobs the cluster browser has to be taught how to connect to a cluster which is running jobs. Click the “Cluster” menu and select , as shown in Figure 1. This will bring a menu like the one in Figure 2. You can give your cluster any name you want; for using a HDInsight cluster choose a type “AzureDfs”.
Clicking on will attempt to add to this menu all clusters for which you have stored HDInsight certificates (if any are found).
Figure 1: Creating a new cluster
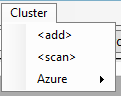
Figure 2: the cluster editor
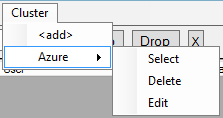
Once you have filled this form, clicking again on the “Cluster” menu will bring up a cluster with the name you have typed, as shown in Figure 3. Choosing “Select” in this menu will enumerate the jobs executed in that cluster.
Figure 3: manipulating a cluster
Once the user has connected to a cluster a display like the one in Figure 4 is shown.
Figure 4: Cluster browser window
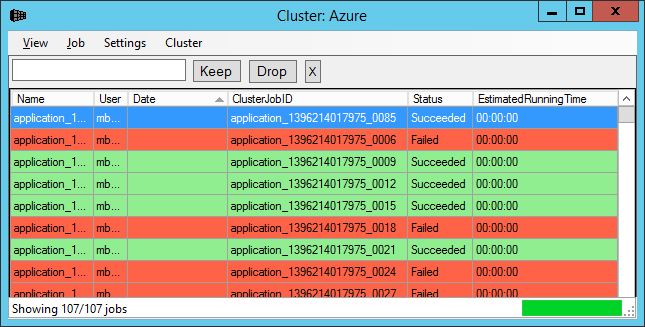
Each job is a displayed on a separate line. The jobs are color coded according to their status: red=failed, green=successful, cyan=running and yellow=cancelled. The cursor points to the currently selected job(s). Several operations can be applied to the selected jobs; some operations can be performed on a single job.
The jobs can be sorted on the displayed columns. They can also be filtered using the three buttons shown in Figure 5. The “Keep” button will only show jobs which match the filter, while the “Drop” button will only show jobs which do not match the filter. The “X” button removes all applied filters.
Figure 5: Filtering jobs

Figure 6: Functionality of the "View" cluster browser menu

Figure 6 shows the operations offered by the “View” menu:
- “cancel current work” can be used to interrupt long-running operations that take place in the background
- “new window” (or hotkey control-N) opens a new cluster browser window
- “Refresh” (F5) refreshes the view of the cluster is refreshed. If the “auto-refresh” checkbox is set, the view will automatically be refreshed every 30 seconds.
- Exit (control-Q) closes the cluster browser and saves some settings about the current view.
The user can perform per-job operations either by selecting a job in the display and using the “Job” menu, or right-clicking in the job display window. The set of operations available is shown in Figure 7.
Figure 7: contextual menu for job operations, invoked through right-click.

By double-clicking on a job, or selecting Job/open in job browser the user invokes the job browser, which is described below. The user can start multiple browsers by selecting multiple jobs.
Note that, although a job may be displayed in this window, the state of the job may not be available on the cluster, or may be only partly available. This is because the cluster job management may garbage-collect information about old jobs, and garbage collection is not instantaneous on all cluster machines: only parts of old jobs may be available for inspection. The user may need to have permissions to start the job browser on a specific job.
The menu item Job/Terminate can be used to terminate a (single) job executed on the cluster. The user may need to have adequate privileges to perform this operation.
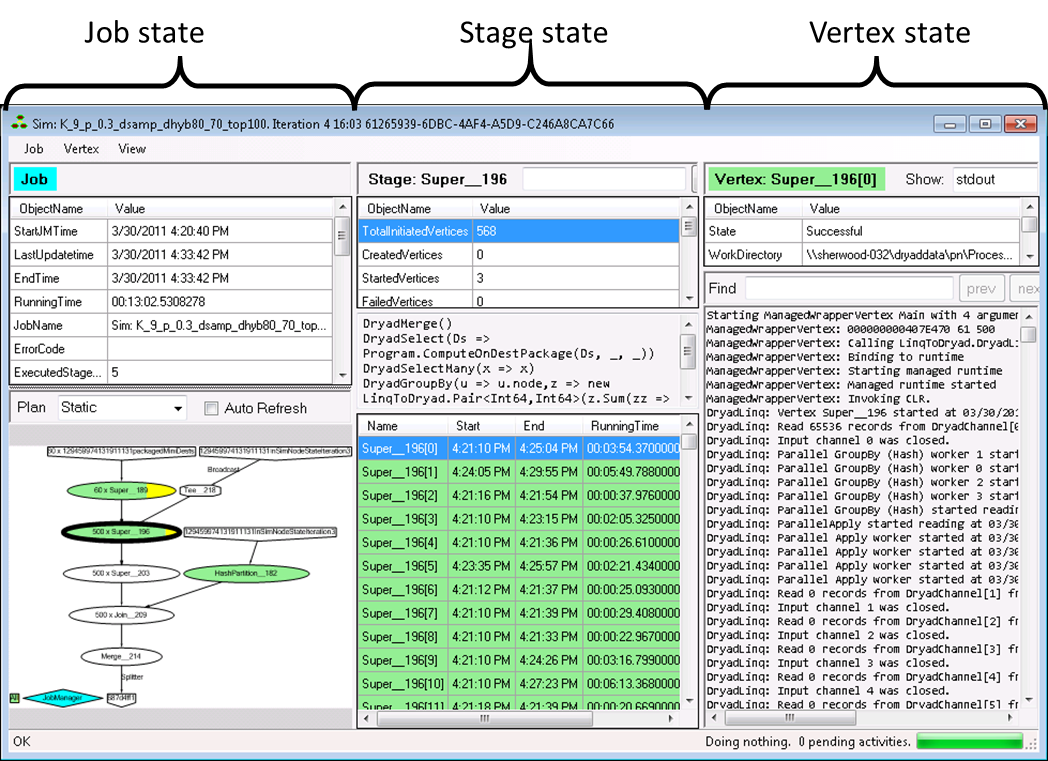
The job browser provides a hierarchical display of the DryadLINQ job information. The job browser shows a snapshot of the job state; the display has to be explicitly refreshed for a running job. There is an auto-refresh checkbox which causes the browser to automatically refresh the state periodically. A screen-shot of the job browser is shown in Figure 8.
Figure 8: The job browser window.
The job browser has to collect information from a potentially large number of large files spread among many machines in the cluster. Since the job browser is an interactive application that runs on a single client machine, data collection could be slow for large jobs. Some information is collected only on-demand, when initiated by user requests.
The job browser is divided into three vertical panes, representing a hierarchy from left to right. The job state pane (left) shows global job information. The user can select one of the job stages by clicking on the job plan. (A stage is a set of vertices that all operate on the same data collection and perform the same computation.) The selected stage is displayed in the middle pane. The stage information includes the list of all vertices in the stage. The user can click on a vertex to select it. Information specific about the selected vertex is shown in the right (vertex) pane.
The panes can be resized; the position and sizes of the panes are saved when the application is quit normally (through the Job/Close menu), and restored on the next execution.
In the remaining of the document we describe briefly the functionality provided by the job browser.
The job summary is in the leftmost top pane, shown in Figure 9. Some of the fields have meaningful values only after the job has completed.
Figure 9: The job summary
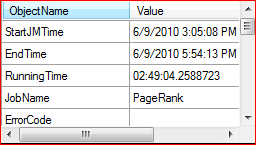
Figure 10 : Selecting the job plan view
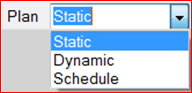
The bottom-left pane can display information about the global job plan. A combo box is used to select one of three different views: static, dynamic and schedule. Note that some views may be unavailable if the information could not be collected from the cluster. The plans displays can be zoomed in/out by using Ctrl + and Ctrl – (or the menu items View/Zoom in, View Zoom out). The menu item View/Zoom to fit (or Ctrl ~) will resize the plan view to fit in the window.
The static plan is a picture of the plan as submitted by DryadLINQ to the cluster. Each stage is represented by an ellipse.
In Figure 11 we show a fragment of a job static plan. The pentagons are inputs and outputs. For example, the shown input contains 60 partitions. The first stage reading from that table is comprised of 60 vertices, numbered Super__230[0] to Super__230[59]. The coloring of the stages is explained below.
Figure 11: Static job plan fragment

The edges between ovals indicate channels. Only two types of channel connections are possible: point-to-point (or, more precisely, round-robin), and all-to-all. The thin edge indicates a point-to-point: each vertex in the top layer is connected to one vertex in the bottom layer.
The thick edges indicate an all-to-all connection. In the example in Figure 11 the top thick edge represents 60x500 channels: one between each of the 60 vertices in the stage Super__230 and each of the 500 vertices in stage Super__237.
All Dryad edges are point-to-point, connecting one source vertex with one destination vertex. The only way to broadcast the contents of a channel is by using a Tee vertex. In the figure the Tee__259 vertex indicates that the rightmost input is read by all 500 vertices in stage Super__237.
The user can click on any stage or edge to select it.
The user can also click on the job input and output stages to display information about the associated distributed collection.
Figure 12 shows a fragment of a dynamic plan display. At run-time the Dryad job graph may dynamically change, so the set of stages displayed is not identical to the ones present in the static plan. In the dynamic display the horizontal axis is time; each box covers the execution time of all vertices belonging to the stage. From this picture we infer that most of the execution time of this job was spent in stage Super__237.
The user can also click on the dynamic plan boxes to select a stage. The user can also zoom-in by dragging a box with the mouse.
Figure 12: Dynamic plan

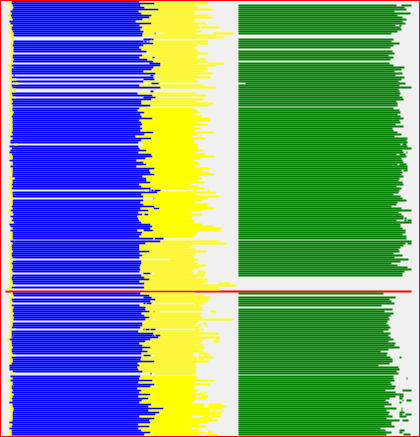
Figure 13 shows a display of a job schedule. The horizontal axis is time, while the vertical axis is machine. Each vertex executed corresponds to one line, showing the time spanned by the vertex execution. Clicking on a line will focus on the corresponding vertex.
Figure 13 : job schedule view. Each vertex is a different line. The vertical axis is the machine, the horizontal axis is time.
The plan views are color coded in one of two ways: by the status of each vertex, or by the stage of each vertex. The coloring can be toggled by using the menu “View/Color by stage” (status), or with hotkey Control-T.
- Coloring by state: each vertex is colored by its current state, which can be one of: successful=green, running=cyan, cancelled=yellow, failed=red, white=not yet started. Figure 11 and Figure 12 show coloring by state.
- Coloring by stage: each vertex is colored according to the stage it belongs to. Figure 13 shows coloring by stage.
The user can toggle the display of cancelled vertices using the menu “Job/Hide cancelled vertices”.
The top-middle pane displays basic statistics about the selected stage, as shown in Figure 14.
Figure 14: Stage statistics: filtering only succesful vertices.
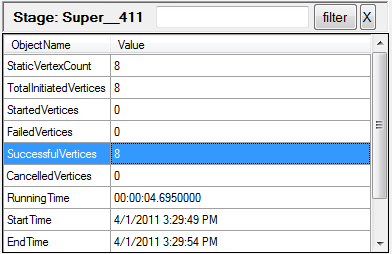
Selecting some of the rows in this table will filter the data in the stage vertices pane (described below). For example, selecting the SuccesfulVertices row (as in Figure 14) will cause the only vertices that are in the Successful state to be displayed.
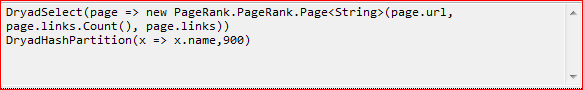
The central pane of the display shows in an abbreviated form the code that is being executed in the selected stage. This code is generated by the DryadLINQ compiler starting from the user-supplied code.
Figure 15: Stage code
The bottom-middle pane displays information about the selected vertices in the selected stage, as shown in Figure 17. The filtering box at the top of the Stage panes can be used to filter vertices by typing a string, as shown in Figure 16.
Figure 16: Filtering stage contents

Figure 17 : Stage vertices

Most fields of this table should be self-explanatory.
For fault-tolerance and scheduling reasons Dryad may execute each vertex multiple times. The v column displays vertex instance version. For a job to succeed, at least one version of each vertex must succeed. Note that there could be multiple successful versions of the same vertex (for example, when a vertex is re-executed because some of its outputs in a previous execution have been corrupted).
The cancelled vertices have been aborted by the runtime before completion. These do not signal failures. Some vertices may be cancelled before they even start running, and then they do not have an assigned machine.
The user can select a row in the stage vertices table to display further information about the corresponding vertex in the right pane.
The top-right pane displays statistics about the selected vertex.
Figure 18 : Vertex statistics

The user can use the combo-box on top next to the vertex name to select additional information to display about the selected vertex. The options provided in the combo box are:
- Nothing
- Vertex standard output file (stdout). This file normally includes all messages printed on console by the user-level code executed by the vertex. (E.g., the programmer can insert Console.WriteLine() in C#, and their output would be routed to this file.) [This feature is currently unavailable.]
- Vertex standard error file (stderr). On some cluster platforms this file does not exist. [This feature is currently unavailable.]
- The error message generated by the vertex.
- The logs generated by the vertex runtime (logs). A description of the format of these logs is behind the scope of this paper.
- The work directory of the vertex. Normally this contains all the information necessary to run the vertex, and often the vertex output files as well.
- The set of inputs of the vertex (a brief description of each of the input channels).
- The set of outputs of the vertex (a brief description of each of the output channels).
- The XML query plan (only for the JobManger vertex), which shows the query plan of the current job.
- The Job log (only for the JobManager vertex), which shows the log of the job progress.
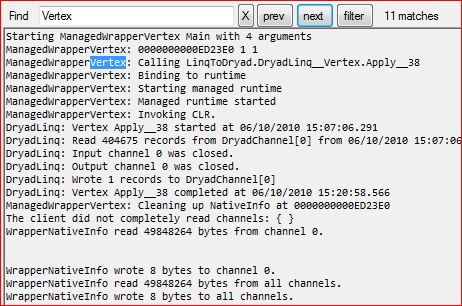
Finally, the bottom-right pane of the browser allows one to inspect some of the state generated by the vertex, as selected by the combo box described above (see Figure 20).
Figure 19: Filtering vertex-generated information

Figure 19 shows some tools that can be used to find information in the displayed files. The Find’ box allows the user to quickly search for strings. The Filter’ button restricts the view to lines that contain the found selection. “Prev” and “Next” navigate through the found matches. Unfortunately there is no `back’ button for this view.
A menu item View/Load file in editor allows the user to load the contents of the pane in an editor of their choice (as indicated by the EDITOR environment variable).
Figure 20: Inspecting vertex state
The display shown in Figure 20 can contain hyperlinks to additional files and folders:
- clicking on reachable hyperlinks will load their contents in the window
- control-clicking on the hyperlinks will open the hyperlinks using Windows explorer