Module does not load first graph (panelId=1) from dashboard #129
Comments
|
Thats an easy one. With Grafana 5 there is no more panelId = 1, All dashboards start at panelid 2. Please check the panelids and correct them in your graph config (also for default dashboard). |
|
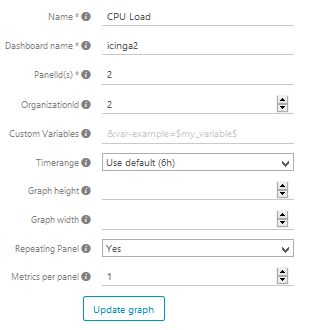
Thanks! I changed to:
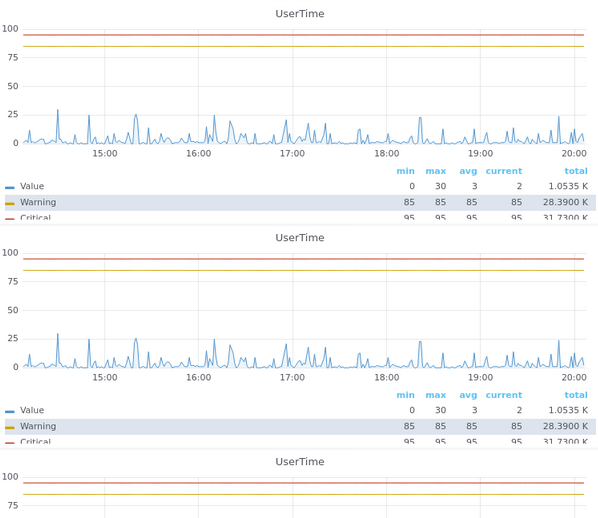
But now I have same graph for all metrics:
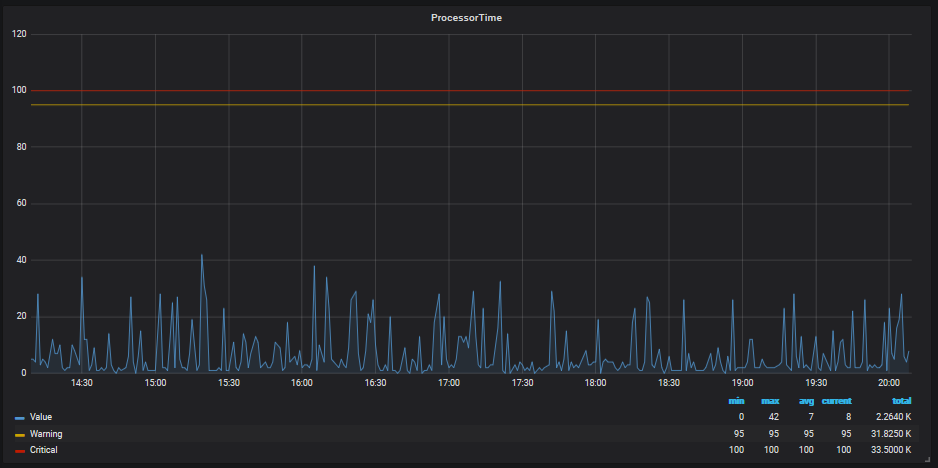
If I click on one graph, Grafana shows the correct graph (https://domain:3000/d/zSfpuxgik/icinga2?var-hostname=host&var-service=CPU%20Load&var-command=check_win_perfmon&from=now-6h&to=now&orgId=2&panelId=3&fullscreen)
|
|
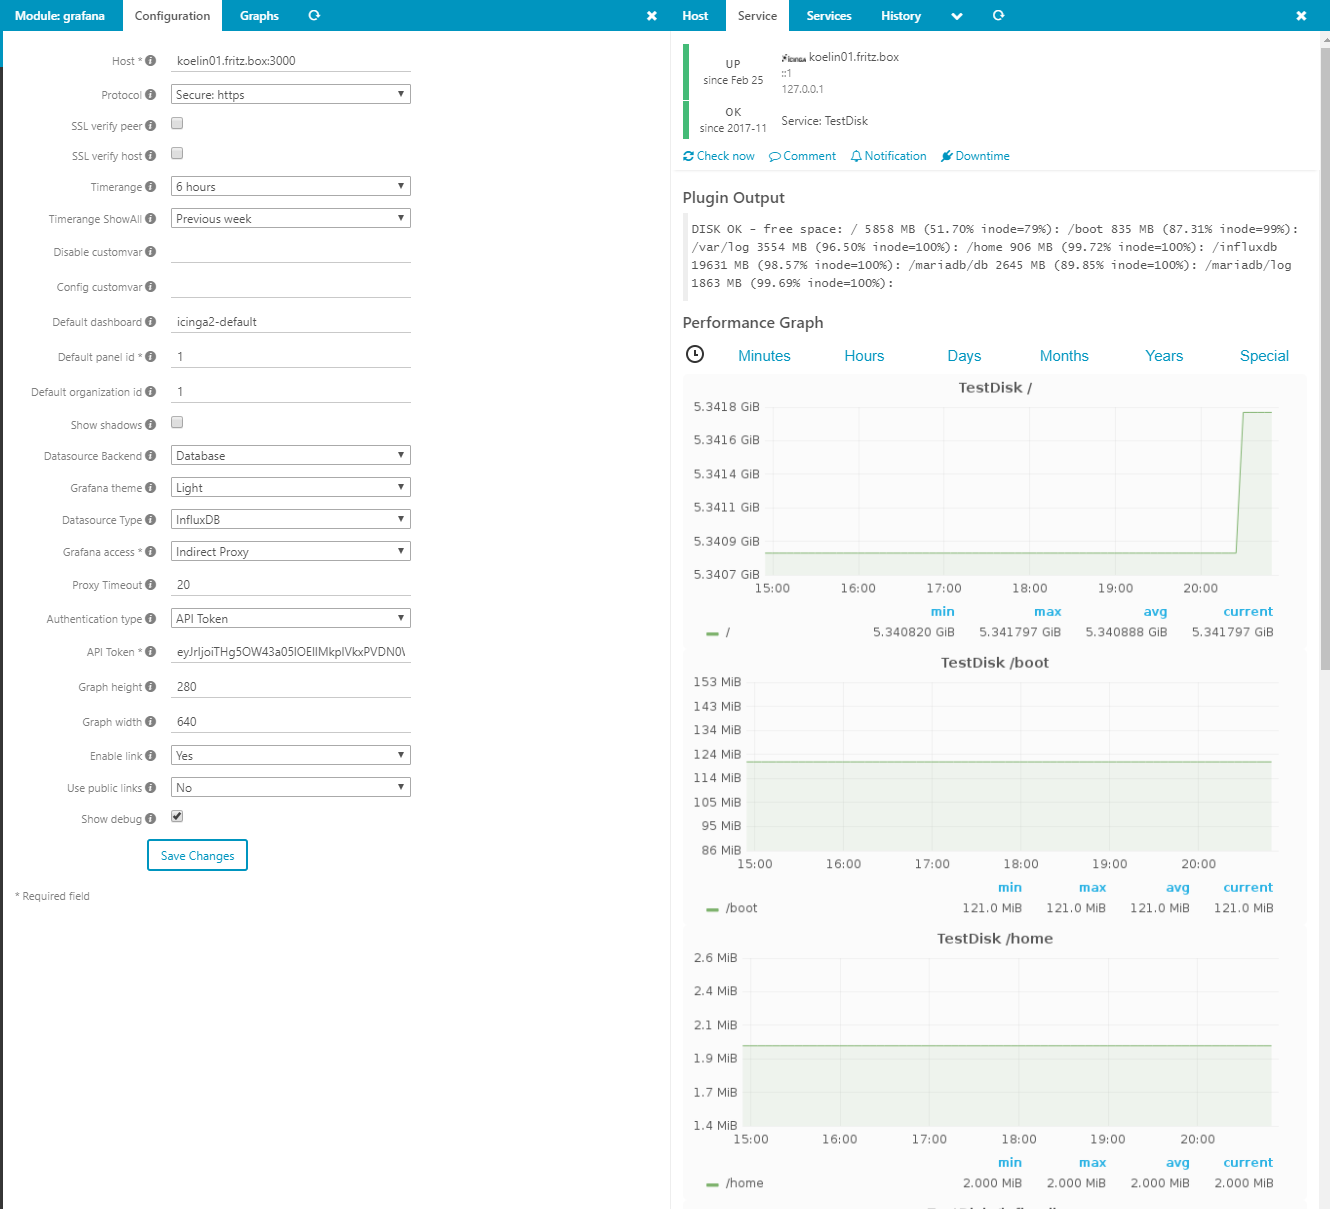
Still testing. Have to create a dashboard with repeating option now. Which module version are you using and if master which access mode ? |
|
Sorry have to stop, iam running into this bug on my installations. |
|
i got the repeating panel problem fixed :) Works with Grafana 4 and 5, but 5 needs a higher timeout
|
Expected Behavior
All graphs are shown
Current Behavior
Panel id 1 does not appear on screen.
Possible Solution
Steps to Reproduce (for bugs)
If I change from proxy to Indirect Proxy, no graphs are loaded due to #128
If I click on first link: https://domainname:3000/dashboard/db/icinga2?var-hostname=hostname&var-service=CPU%20Load&var-command=check_win_perfmon&from=now-6h&to=now&orgId=2&panelId=1&fullscreen
It shows all graphs instead of graph 1
If I click on second link:
Context
Before update to Grafana v5.0.1 I have no problems.
Your Environment
icinga2 --version): r2.8.1-1icinga2 feature list): api checker command ido-mysql influxdb mainlog notificationicinga2 daemon -C):information/cli: Icinga application loader (version: r2.8.1-1)
information/cli: Loading configuration file(s).
information/ConfigItem: Committing config item(s).
information/ApiListener: My API identity: domainname
information/ConfigItem: Instantiated 1 ApiListener.
information/ConfigItem: Instantiated 82 Zones.
information/ConfigItem: Instantiated 81 Endpoints.
information/ConfigItem: Instantiated 2 ApiUsers.
information/ConfigItem: Instantiated 1 FileLogger.
information/ConfigItem: Instantiated 770 Notifications.
information/ConfigItem: Instantiated 2 NotificationCommands.
information/ConfigItem: Instantiated 224 CheckCommands.
information/ConfigItem: Instantiated 15 HostGroups.
information/ConfigItem: Instantiated 1 IcingaApplication.
information/ConfigItem: Instantiated 1 EventCommand.
information/ConfigItem: Instantiated 82 Hosts.
information/ConfigItem: Instantiated 3 Comments.
information/ConfigItem: Instantiated 1 UserGroup.
information/ConfigItem: Instantiated 3 Dependencies.
information/ConfigItem: Instantiated 1 User.
information/ConfigItem: Instantiated 3 TimePeriods.
information/ConfigItem: Instantiated 688 Services.
information/ConfigItem: Instantiated 6 ServiceGroups.
information/ConfigItem: Instantiated 1 CheckerComponent.
information/ConfigItem: Instantiated 1 ExternalCommandListener.
information/ConfigItem: Instantiated 1 IdoMysqlConnection.
information/ConfigItem: Instantiated 1 InfluxdbWriter.
information/ConfigItem: Instantiated 1 NotificationComponent.
information/ScriptGlobal: Dumping variables to file '/var/cache/icinga2/icinga2.vars'
information/cli: Finished validating the configuration file(s).
The text was updated successfully, but these errors were encountered: