Author: Mauricio Giraldo Arteaga @mgiraldo / NYPL Labs @nypl_labs
Additional contributor: Thomas Levine @thomaslevine
A open-source map vectorizer. Provided as is by NYPL Labs. Project based on a workflow suggested by Michael Resig.
The output of this process can be verified by volunteers with the Building Inspector.
A paper on this process was published in the MapInteract '13 Proceedings of the 1st ACM SIGSPATIAL International Workshop on MapInteraction where it won the Best Paper Award.
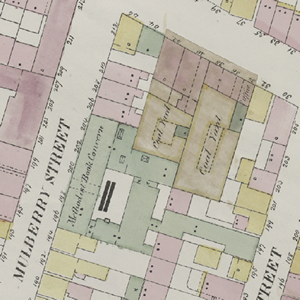
This project aims to automate the manual process of geographic polygon and attribute data extraction from maps (i.e. georectified images) including those from insurance atlases published in the 19th and early 20th centuries. Here is some background on why we're doing this and here is one of the maps we're extracting polygons from. This example map layer shows what these atlases look like once geo-rectified, i.e. geographically normalized.
The New York Public Library has hundreds of atlases with tens of thousands of these sheets and there is no way we can extract data manually in a reasonable amount of time.
Just so you get an idea, it took NYPL staff coordinating a small army of volunteers three years to produce 170,000 polygons with attributes (from just four of hundreds of atlases at NYPL).
It now takes a period of time closer to 24 hours to generate a comparable number of polygons with some basic metadata.
The goal is to extract the following data (✔ = mostly solved so far, ✢ = in progress):
- ✔ shape
- ✔ color
- ✢ dot presence
- ✢ dot count
- ✢ dot type (full vs outline)
- skylights
- numbers (not optimistic, but maybe one of you knows how extract numbers from these images)

A few things to be installed in your system in order to work properly. So far it has been tested on Mac OS X Lion so these instructions apply to that configuration only. I am sure you will be able to adapt it to your current configuration.
- Python with OpenCV and PIL
- If you use PIP (recommended) you will get the necessary Python packages with:
pip install -r requirements.txt
- If you use PIP (recommended) you will get the necessary Python packages with:
- R - Make sure it is in your PATH (so you can run it via command-line by typing
R). - You'll need the following R packages. On OS X simply navigate to
Packages & Data, choose your CRAN mirror region, then search for and install:alphahull(you will needtripack,sgeostat,splancsas dependencies)igraphshapefilesrgdal(download the binary for your OS then runR CMD INSTALL --configure-args="" path/to/rgdal.tar.gz)- You can also install the requirements by running this in the R CLI (by typing
Rin a terminal window):
    install.packages('rgdal')
    install.packages('alphahull')
    install.packages('igraph')
    install.packages('shapefiles')
- Test that everything in R is installed, on the CLI you should be able to run this with no errors:
    library(rgdal)
    library(alphahull)
    library(igraph)
    library(shapefiles)
    quit() # this will quit R
- GIMP
- GDAL Tools, on OS X try version 1.9. Per MapBox: The first time you install the GDAL package there is one additional step to make sure you can access these programs. In Mac OS, Open the Terminal application and run the following commands:
    echo 'export PATH=/Library/Frameworks/GDAL.framework/Programs:$PATH' >> ~/.bash_profile
    source ~/.bash_profile
- It is also a good idea to install QGIS to test your results
These step by step instructions should work as-is. If not, check all the above are working before submitting an issue.
- Take note of the path where the GIMP executable is installed (the default value in the vectorizer is the Mac OS location:
/Applications/Gimp.app/Contents/MacOS/gimp-2.8). - Run the script on the provided test GeoTIFF:
python vectorize_map.py test.tif - Accept the GIMP folder location or input a different one and press ENTER.
NOTE: The vectorizer has problems with filenames that contain spaces. This will be supported eventually.
This should take about 70 seconds to process. If it takes less there might be an error (or your machine rulez). Take a look at the console output to find the possible culprit.
If it works, you will see a test folder with a test-traced set of files (.shp, .dbf, .prj and .shx) and two log files.
vectorize_map.py supports a few configuration options.
usage: vectorize_map.py [-h] --gimp-path GIMP_PATH [--chunksize CHUNKSIZE]
                        [--image-processing-configuration-file VECTORIZE_CONFIG]
<input file or dir><input file or dir>path to file (or folder with files) to vectorize
This are really required because 1) you won't have GIMP installed in the same folder as us and 2) your maps look different from the test map and you will want to have a config file.
--gimp-path GIMP_PATHpath to GIMP executable (defaults to/Applications/Gimp.app/Contents/MacOS/gimp-2.8)--image-processing-configuration-file VECTORIZE_CONFIG, -p VECTORIZE_CONFIGpath to map image processing configuration file (defaults tovectorize_config_default.txt)
-h, --helpshow help message and exit--chunksize CHUNKSIZE(ignore this but determines how to split temp file… but really, ignore it)
The Vectorizer was made to work with the NYPL map atlases. It is likely that your maps have different quality and colors. In order for this to work in your maps, you first need to do some minor config adjustments to generate a proper threshold file for your set (assuming it is a map set similar to the provided example test.tif):
- Your map needs to be in WGS84 projection. Other projections might be supported in the future. Use
gdalwarpto make this conversion like so:
gdalwarp -t_srs "EPSG:4326" input.tif output.tif
- Open a representative from map (or maps) in GIMP
- With the color picker, select the color that most represents the paper/background color (using a 5-pixel averaging pick would be best). Make note of the red, green and blue values (0-255).
- Do the same for the building colors (like the pink, green, blue in the example).
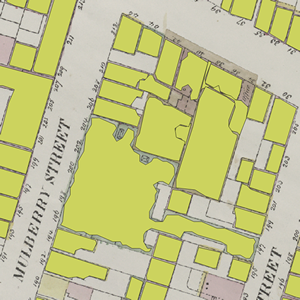
You now want to produce a neat black-white image where lines are black and all the rest is white:
- Apply
Colors > Brightness-Contrast...looking to make the lines darker and buildings/paper brighter. The default values are -50 brightness and 95 contrast. These may or may not work for you. Make note of the values that work best. - Now apply
Colors > Threshold.... This takes a black and a white value. Anything darker/lighter than these values will become black/white respectively. The default values are 160 black and 255 white. Make note of the values that work best.
You now have the configuration values for your maps (map color list, brightness-contrast values, threshold values). Open vectorize_config_default.txt and replace the default values with your custom values. Save it as vectorize_config.txt (and keep the default just in case). Your config file should look like:
BRIGHTNESS_VALUE,CONTRAST_VALUE,BLACK_VALUE,WHITE_VALUE, brightness-contrast-thresholdblack-thresholdwhite
PAPER_RED,PAPER_GREEN,PAPER_BLUE,paper
BLDG_RED,BLDG_GREEN,BLDG_BLUE,somebuildingcolor
BLDG_RED,BLDG_GREEN,BLDG_BLUE,someotherbuildingcolor
...
It should always start with brightness/contrast/threshold in the first line and paper in the second line. There should also be at least one building color. You can add as many building colors as you wish (since our maps at NYPL are hand-colored, colors are not uniform so we have lighter/darker versions to compensate that).
When you run the vectorizer again, it will find this config file and use those values instead of the defaults.
It is likely that the vectorizer won't produce excellent results in the first try. It is a matter of adjusting these color values to generalize as much as possible to your map set.
map_vectorizer/templates contains images that we use in OpenCV to match crosses and other marks on maps.
test.tif is a file for testing.
The other images in the root are for the readme.
simplify_map.R is used by vectorize_map.py
bin/consolidator.py for consolidating multiple outputs of a vectorize_map.py process into a single shapefile/GeoJSON. For example, when you run vectorize_map.py on a folder full of GeoTIFFs and then need to group all the individual folder outputs into a master file.
Usage: ./bin/consolidator.py path/to/folder (no trailing slash)
- Michael Resig
- Chris Garrard for his sample code to assemble and disassemble shapefiles
- Barry Rowlingson for his tutorial on converting alpha shapes to polygons
- 0.11: Including OpenCV in the
requirements.txt. - 0.10: Refactored Python code for better parameter management and cleaner folder structure.
- 0.9: Vectorizer now produces centroids (
calculate_centroids.pyis less necessary now). - 0.8: Documented
consolidator.py. Minor bug fixes. - 0.7: Calculating average color with PIL instead of ImageMagick. Removed ImageMagick dependency, added PIL as dependency.
- 0.6: Fixed bug introduced in 0.5. Removed mention to GIMP preferences in README.
- 0.5: Added support for absolute paths.
- 0.4: Added a config file (rename
vectorize_config_default.txttovectorize_config.txt). - 0.3: Added
consolidator.pyto assemble a set of shapefiles in a folder into a single file. - 0.2: Added very rough OpenCV circle and cross detection (not working very well but it is a starting point).
- 0.1: Added GeoJSON output.