Skip to content
New issue

Have a question about this project? Sign up for a free GitHub account to open an issue and contact its maintainers and the community.

By clicking “Sign up for GitHub”, you agree to our terms of service and privacy statement. We’ll occasionally send you account related emails.

Already on GitHub? Sign in to your account

Proposal for VisualizationWidgets class organization #239

Open
h-mayorquin opened this issue Nov 30, 2022 · 5 comments
Open

Proposal for VisualizationWidgets class organization #239

h-mayorquin opened this issue Nov 30, 2022 · 5 comments

Comments

@h-mayorquin
Copy link
Contributor

h-mayorquin commented Nov 30, 2022

This is a draft / work in progress. As we are finishing #232 and I am switching to work in other projects I wanted to write my thoughts of what could be a general schema or abstract class for the visualization widgets in the library. Two preliminary points:

  1. I am not sure yet if going all the way to an abstract class at this point is useful (or if it will be ever be). Visualization is a category that is difficult to formalize and maybe over-constraining the design with an abstract class will create more problems that it solves. So the proposal here starts more humble as a mere suggestion for code organization.
  2. This is specific to the widgets that contain some sort of plot. Not all of them do, as an example, nwbwidgets.file.show_nwbfile just displays some text and is outside of the scope of the proposal here.

Proposal

My claim is that is useful to think about visualization widgets as coordination classes in charge composition, layout and interaction between controllers, data and plotting. The idea can be sumarized in the following diagram:
2022-11-30(VisualizationWdiget)

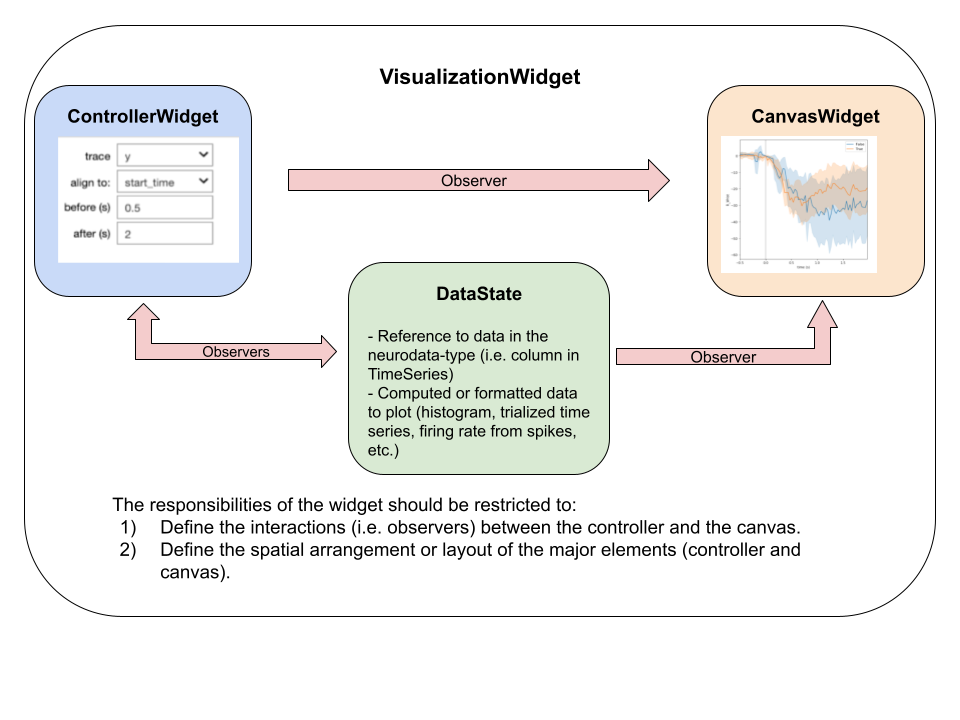
In brief, the role of the
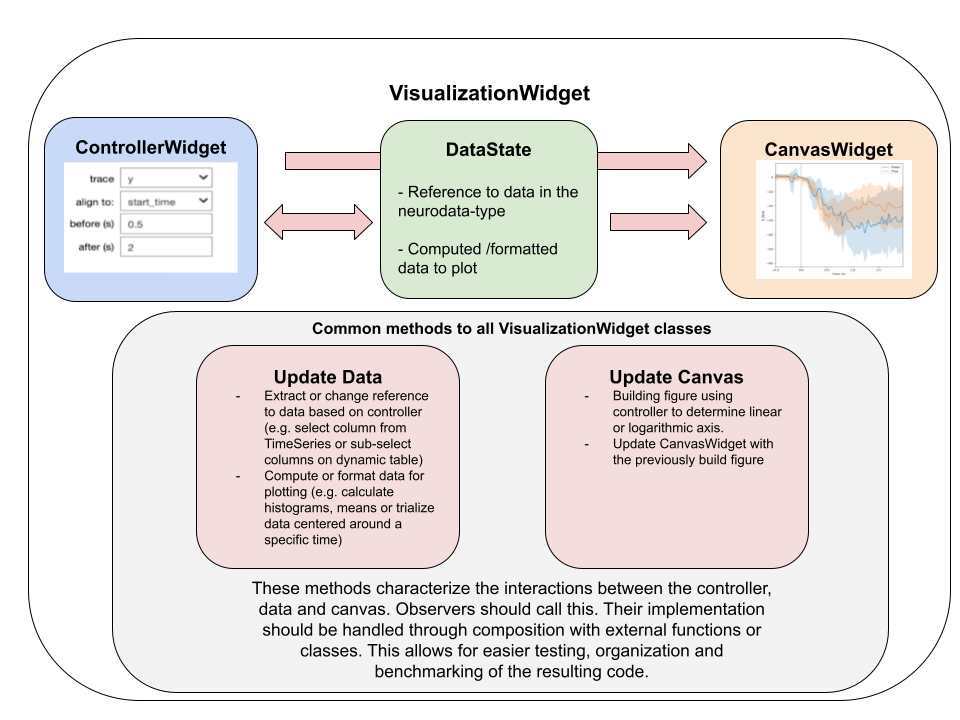
 VisualizationWidget is to coordinate the interaction between a ControllerClass, a CanvasClass and the data extracted and processed from the neurodata types (i.e. a TimeSeries or a DynamicTable). A minor role of the VisualizationWidget is to define the layout between the controllers and the canvas (usually done with Box mechanism). The most important responsability of the VisualizationWidget is to define the interactions between the data and the canvass which is done with the jupyter widgets observer mechanism. Furthermore, I think we should aim to isolate the definition of the interactions (i.e. establishing them) from theircomputational and rendering actions. Their definitions are done in the VisualizationWidget class and their actions are done separately and called with a dedicated method to reduce coupling between these two functionalities. See the following diagram:
2022-11-30(VisualizationWidgetDetails)

In more detail, the methods update_data (in charge of extracting and processing data according to the controller state) and update_canvas (in charge of building the plot and updating the CanvasWidget) are attached with the observer mechanism to the controller class (this is the definition of the interaction mentioned above) and they implement their actions with external functions (composition) for the sake of keeping the coupling of the code low. That is, for each VisualizationWidget instance there should be a separate stand alone function that is in charge of processing the data to make it plot-ready (i.e. extract the data from the units table and build a firing rate histogram) and a separate stand alone function that is in charge of buidling a plot (i.e. get a series of spikes and produce an histogram). The idea is that these functions should be called inside of update_data and update_plot respectively (their point of contact) but they can be analized, tested and benchmarked on their own keeping the coupling low and the code organized.

A bare-bones pseudocode-like implementation is shown now to drive the point home and hopefully make the idea clearer in case I missed something:

class VisualizationWidget(widgets.HBox):
    """
    The role of this class would be to define and coordinate the relationships between a controller and a computing and 
    plotting functionality. 
    """
    def __init__(self, neuro_data_type, foreign_controller, widget_kwargs, controller_kwargs):
        super().__init__()

        # Initialize controller
        if foreign_controller is None:
            self.controller = VisualizationWidgetController(neuro_data_type, **controller_kwargs)
        else:
            self.controller = foreign_controller 

        # Initialize figure (could be a general placeholder)
        initial_figure = intialize_figure()
        self.canvas_widget = go.FigureWidget(initial_figure)
        
        # Build the layout of widget using HBox, VBox or GridspecLayout
        self.children = [self.control, self.canvas_widget]

        # Assign computing observers (alternatively could be done with widgets.Button)
        self.controller.widget_1.observe(self.update_data, names="value")
        self.controller.widget_3.observe(self.update_data, names="value")

        # Assign ploting observers (alternatively could be done with widgets.Button)
        self.controller.widget_x.observe(self.update_canvas, names="value")
        self.controller.widget_z.observe(self.update_canvas, names="value")

    def update_data(self):
        """
        This functions updates the state data, that is, the data to be plotted and the state of the widget.
        In more detail, when a relevant parameter in the controllers change this function should be called to 
        recalculate the data necessary for plotting this. 
        
        Also, this function could return -before the calculation- an estimation of memory or computational requirements 
        and throw warning / stop when it is too large / slow. 
        """     
        
        ## Possible structure
        # 1) Estimate memory and computational resources [optional]
        # 2) Decide whether to run the computation [optional]
        # 3) Computer the new data state (that is, the data to be plotted in the figure widget)
        
        # extracted_data = extract_data_from_neurodata_types()  <- update the data
        # self.data_to_plot = external_formatting_function(extracted_data) <- format the data such that is ready for plotting
        pass 
    
    def update_canvas(self):
        """
        This function updates the canvas_widget and its responsability is to generate the plot and render it on the
        figure widget.            
        """
        
        ## Possible structure
        # 1) Have an external function that builds the plot at is. The idea is that this function could be used as a
        # stand alone for quick debugging and testing outside of the logic of this class (composition)
        # 2) Update the canvas widget
        
        # Use the data in the state as computed by the computing_update function 
        #figure = external_plot_function(self.data_to_plot)             
        # canvas_widget.update(figure)  

        pass
@h-mayorquin
Copy link
Contributor Author

More details about the controllers:

The controller class above should be a different class on its own (inherting from widgets.Box) whose only role is to provide simple and intuitive access to the values of the controller widgets (i.e. dropdown , float selelction, integer sliders, etc). This is important because controllers are modular structures that are usually a combination of either HBox and VBox and therefore their values are behind their children attributes making it hard to access them cleanly (this results in code like controller.modular_controller1.children[2].modular_controler2.children[0].value) The benefit here is separating the logic of the controller definition and construction (the responsability of a controller class) from the definition of its interaction with the extraction, computation and plotting of the data (the responsability of the visualization widget class). Another important point is that the interactions between the widgets of the controller should be defined here. There are times when the state of one controller afects the other (e.g. one restricts its choices or toggles the vissibility of another widget off).

As a very rough draft this how I envision a companion controller class to a VisualizationWidget to look like:

class VisualizationWidgetController(widgets.Box):
    
    def __init__(self, neuro_data_type, controller_kwargs):
        super().__init__()

        
        # Definite all the widgets of the controllers
        initialize_control_widgets()

        # Call the abstract method that makes all the values available all the top level
        make_root_levels_available()
        
    def initialize_control_widgets(self):
        """
        All the widgets and their interactions should be defined and initialized here
        """
        self.dropdown_widget = widgets.Dropdown(value=value, options=options description="description")
        self.float_text_widget = widgets.FloatText(0.0, step=0.1, description="start (s)")
        
        # Set interactions as observers between them (in case one widget values modify the options of another)
        self.dropdown_widget.observe(self.upddate_float_text_widget, names="value")
        self.float_text_widget.observe(self.update_dropdown_widget, names="value")
        
    # This could be a general method of a general Controller abstract class as its logic should be common to all
    def make_root_levels_available(self):
        """
        The role of this function is make all the values of the widgets available as top level attrbiutes. This should
        improve to readability when interacting with this calss as it avoids having to access attributes inside HBox or
        VBox which are hidden in a list as children. 
        """
        
        pass
        
    def update_dropdown_widget(self):
        
        pass
    
    def upddate_float_text_widget(self):
        
        pass

The canvas widget can be either a go.FigureWidget, a widgets.Output or something yet to be used. Its main role is to function as the space where the visualization is presented.

@h-mayorquin h-mayorquin changed the title Proposal for organizing VisualizationWidgets Proposal for VisualizationWidgets class organization Nov 30, 2022
@CodyCBakerPhD
Copy link
Collaborator

Thanks for the formal writeup and figures, this looks great!

A couple notes from our discussion yesterday:

  1. The use of the word 'widget' is highly overloaded and can result in occasional confusion as well as some very long class names. I'd suggest removing it from the class titles of each base in Fig. 1 (a Visualization that consists of a Controller and a Canvas; good choice on 'canvas' btw!). We know that they consist of ipywidgets elements in some way or another, reflecting the fact that these all end up as NWB 'widgets' when all is said and done, but I don't think it has to be stated each and every time.

  2. An example of overloaded confusion comes up in the section on Controllers

Another important point is that the interactions between the widgets of the controller should be defined here. There are times when the state of one controller affects the other (e.g., one restricts its choices or toggles the visibility of another widget off).

to which I'd also like to adjust the terminology of a general Controller class so that its attributes are referred to as components, which can themselves be other Controllers or very simple explicitly defined widgets (like sliders) but referring to the components as 'widgets' does not make it clear in discussion what items are being referenced. So to rephrase the point

Another important point is that the interactions between the components of the controller should be defined here. There are times when the state of one component affects the other (e.g., one restricts its choices or toggles the visibility of another component off).

  1. I do still think that the update_data step should be split into two sub-parts, the loading of the data and its processing (which could be an identity mapping in cases where the data to plot is merely the data extracted). This could be useful in cases where some parts of the Controller are being used only to adjust parameters of the computation acting on the same block of extracted data. I'd recommend
def extract_data(self, neurodata, field: str, selection: Union[slice, Tuple[slice]]):
    # Define how to select data from from a field of the neurodata object
    # E.g., self.data = ....  # the current data block

def process_data(self, **kwargs):  # can be whatever Visualization specific arguments are needed/set by controllers
    self.data_to_plot = some_processing(self.data, **kwargs)

and some update calls may do one or the other separately.

@CodyCBakerPhD
Copy link
Collaborator

Another thing important to note here is we're not proposing a massive refactor of all widgets at the current time, just a more structured guideline for the creation of new widgets (which we will implement in the two current major PRs #232 and #230) which can be incorporated into the documentation for future development as well.

@CodyCBakerPhD
Copy link
Collaborator

CodyCBakerPhD commented Dec 4, 2022

See #241 for implementation of much of this design...

Another aspect I found very useful in practice was breaking up each step of your proposed workflow into separate update and setup commands; the setup being called only once but nonetheless having potentially unique behavior if the neurodata types being plotted can be large enough amount of time to process, thus requiring conditions for managing/subsetting the data to a fixed size so that the initial plot from the outer accordion is expected to be handled instantly.

@CodyCBakerPhD
Copy link
Collaborator

Overall I found this design very helpful over several cases of generalizing/extending parent/child visualizations (and controllers, too!). Not only does it make it easier to code this up, it makes it more readable, more scalable, and once I get around to it, more testable.

Sign up for free to join this conversation on GitHub. Already have an account? Sign in to comment
Labels
None yet
Projects
None yet
Development

No branches or pull requests

2 participants