Skip to content
New issue

Have a question about this project? Sign up for a free GitHub account to open an issue and contact its maintainers and the community.

By clicking “Sign up for GitHub”, you agree to our terms of service and privacy statement. We’ll occasionally send you account related emails.

Already on GitHub? Sign in to your account

Multiple line charts don't work? #756

Closed
anta40 opened this issue Jun 12, 2015 · 3 comments
Closed

Multiple line charts don't work? #756

anta40 opened this issue Jun 12, 2015 · 3 comments

Comments

@anta40
Copy link

anta40 commented Jun 12, 2015

Hello,

I'd like to draw Bollinger Band, so guess I need 3 line charts and 1 candle chart.
And this is my code (which is based on CombinedChartActivity.java):

      protected void onCreate(Bundle savedInstanceState) {
    super.onCreate(savedInstanceState);
    setContentView(R.layout.activity_chart);

    mChart = (CombinedChart) findViewById(R.id.chart);
     mChart.setDescription("");
     mChart.setBackgroundColor(Color.WHITE);
     mChart.setDrawGridBackground(false);
     mChart.setDrawBarShadow(false);
     mChart.setDrawOrder(new DrawOrder[] {DrawOrder.LINE, DrawOrder.LINE, DrawOrder.LINE, DrawOrder.CANDLE});

     YAxis rightAxis = mChart.getAxisRight();
     rightAxis.setDrawGridLines(false);

     YAxis leftAxis = mChart.getAxisLeft();
     leftAxis.setDrawGridLines(false);

     XAxis xAxis = mChart.getXAxis();
     xAxis.setPosition(XAxisPosition.BOTH_SIDED);

     CombinedData data = new CombinedData(mMonths);
     data.setData(generateCandleData());
     data.setData(generateLineData1());
     data.setData(generateLineData2());
     data.setData(generateLineData3());
     mChart.setData(data);
        mChart.invalidate();

}

private LineData generateLineData1() {

    LineData d = new LineData();

    ArrayList<Entry> entries = new ArrayList<Entry>();

    float[] values = new float[]{ 88, 89, 89, 89, 89, 90 , 90, 90, 90, 91, 88 , 88};

    for (int index = 0; index < itemcount; index++)
        entries.add(new Entry(values[index], index));   

    LineDataSet set = new LineDataSet(entries, "Line 1");
    set.setColor(Color.rgb(240, 238, 70));
    set.setLineWidth(2.5f);
    set.setCircleColor(Color.rgb(240, 238, 70));
    set.setCircleSize(5f);
    set.setFillColor(Color.rgb(240, 238, 70));
    set.setDrawCubic(true);
    set.setDrawValues(true);
    set.setValueTextSize(10f);
    set.setValueTextColor(Color.rgb(240, 238, 70));

    set.setAxisDependency(YAxis.AxisDependency.LEFT);

    d.addDataSet(set);

    return d;
}

private LineData generateLineData2() {

    LineData d = new LineData();

    ArrayList<Entry> entries = new ArrayList<Entry>();

    float[] values = new float[] {91, 91, 92, 92, 95, 90, 95 , 94, 95, 96, 98, 99};

    for (int index = 0; index < itemcount; index++)
        entries.add(new Entry(values[index], index));

    LineDataSet set = new LineDataSet(entries, "Line 2");
    set.setColor(Color.GREEN);
    set.setLineWidth(2.5f);
    set.setCircleColor(Color.rgb(240, 238, 70));
    set.setCircleSize(5f);
    set.setFillColor(Color.rgb(240, 238, 70));
    set.setDrawCubic(true);
    set.setDrawValues(true);
    set.setValueTextSize(10f);
    set.setValueTextColor(Color.rgb(240, 238, 70));

    set.setAxisDependency(YAxis.AxisDependency.LEFT);

    d.addDataSet(set);

    return d;
}

private LineData generateLineData3() {

    LineData d = new LineData();

    ArrayList<Entry> entries = new ArrayList<Entry>();

    float[] values = new float[] {85, 85, 86, 86, 80, 80, 83, 84, 82, 85, 80, 86};

    for (int index = 0; index < itemcount; index++)
        entries.add(new Entry(values[index], index));

    LineDataSet set = new LineDataSet(entries, "Line 3");
    set.setColor(Color.RED);
    set.setLineWidth(2.5f);
    set.setCircleColor(Color.rgb(240, 238, 70));
    set.setCircleSize(5f);
    set.setFillColor(Color.rgb(240, 238, 70));
    set.setDrawCubic(true);
    set.setDrawValues(true);
    set.setValueTextSize(10f);
    set.setValueTextColor(Color.rgb(240, 238, 70));

    set.setAxisDependency(YAxis.AxisDependency.LEFT);

    d.addDataSet(set);

    return d;
}

protected CandleData generateCandleData() {

    CandleData d = new CandleData();

    ArrayList<CandleEntry> entries = new ArrayList<CandleEntry>();

    for (int index = 0; index < itemcount; index++)
        entries.add(new CandleEntry(index, 20f, 10f, 13f, 17f));

    CandleDataSet set = new CandleDataSet(entries, "Data");
    set.setColor(Color.rgb(80, 80, 80));
    set.setBodySpace(0.3f);
    set.setValueTextSize(10f);
    set.setDrawValues(false);
    d.addDataSet(set);

    return d;
}

Out of those 3 line charts, only the last 1 is drawn. Is this indeed a bug, or maybe I simply don't understand how to use the API properly? I'm using MPAndroidChart 2.1.0, btw.

@PhilJay
Copy link
Owner

PhilJay commented Jun 12, 2015

Put the lines into one LineData object, not 3 different ones.

@PhilJay PhilJay closed this as completed Jun 12, 2015
@ITM15-HR
Copy link

Thanks, that works great :)
I just created one LineData and added all LineDataSets to it.

Works perfectly!

@maniixm
Copy link

maniixm commented Jul 22, 2018

capture

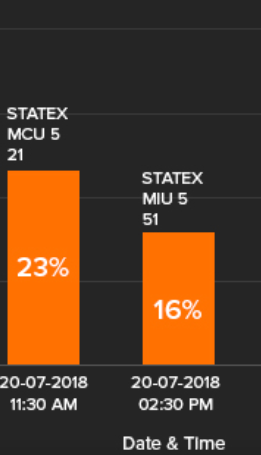
I want to display like this ... multiple line xaxis and values

Sign up for free to join this conversation on GitHub. Already have an account? Sign in to comment
Labels
None yet
Projects
None yet
Development

No branches or pull requests

4 participants