Possibility to run R script with breakpoints #89
Comments
|
The extension doesn't give you the full debugging capabilities built into VS Code, but you can always add a |
|
@jacob-long |
|
Would be really interested in debugging functionality for R. It is listed as a TODO, is there any update on this? Thank you! |
|
I'm digging into this topic using the file-based approach suggested in #143. If we can inject hook functions in browser mode so that each action (such as continue, step in, etc.) can trigger the hook function, we can write out session and breakpoint information to debugger through DAP. So far I have not found any easy way to do that. Maybe we have to look at how RStudio does it and it is best that we don't have to hack too much into R internals. |
|
I believe RStudio uses a client/server approach, with the R session running in the server, so they have more access to the session. It looks like they directly inject a |
|
@andycraig, yes, |
|
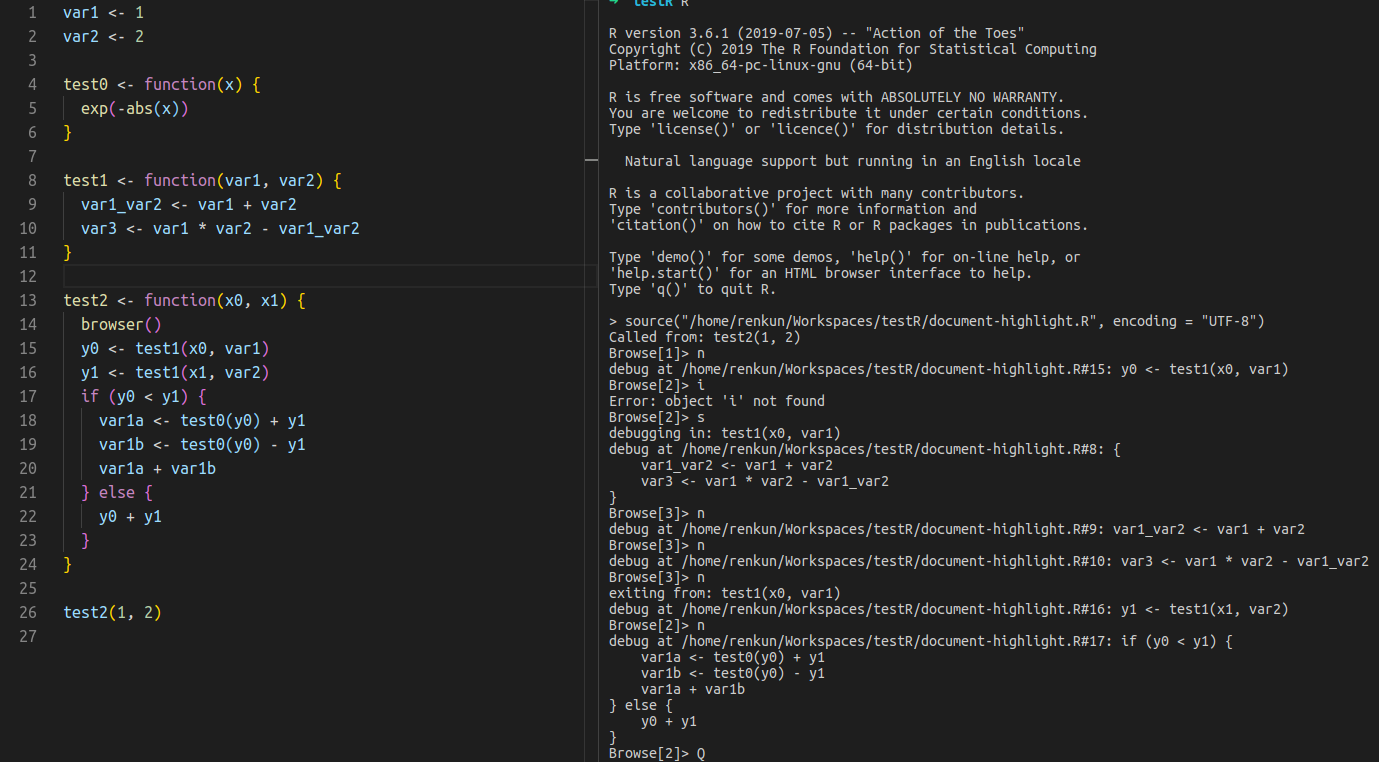
In VSCode, debugging runs in a fresh session on each start debugging. We only have to translate debugger action to stdin and capture stdout and stderr from the R process. The code location is clearly printed out on each code location change.
For debugging in user code in vscode, I believe it is mainly about implementing an DAP-compliant adapter that communicates with R through std in/out/err. However, there are some tricky parts:
|
|
@renkun-ken This is sounding promising! When the user sets a breakpoint in VSCode, is the idea that |
|
@jacob-long
Could you explain in more detail how do to that in a minimal example? At first, set a breakpoint at the line containing "bla <- list(1,2,3)" via left-click on the left-hand side of the editor. Finally, start the debugging session via F5 of the currently opened file? Thanks in advance for clarifying this with more details. |
|
@AndyLuckert we haven't yet implemented a debugging server that is compliant with Debug Adapter Protocol to work with R and VSCode. That's why you can't find a debugger in VSCode to launch an R session to debug a script. When you hit F5 you enter the VSCode deubgging session only when a debugger that implements DAP for R is provided. Unfortunately, we don't have one at the moment. And we are trying to figure out a way to implement one in the future. R's native debugger works in pure command line. When you call The debugger we are trying to implement to work with R and VSCode is probably through such an interface. |
|
That sounds good, that you're planning/working on the future implementation of a proper R-debugger! I've just tried to implement this browser()-approach in an R-script I'd like to debug: As you can see, I've inserted "browser()" into the script at a specific code-line. Unfortunately, nothing happened. The script was just running through without stopping at the point where I put browser, nor was there any reaction regarding this additional code-line whatsoever. Thanks again in advance. |
|
@AndyLuckert
|
|
Alright, thanks! I'll try it out when I get to it. |
|
I've been working on an R debugger recently, following the same approach as @renkun-ken described. Since this approach is quite different from the current R extension, I decided to do so in a new project. If you have the time to try the debugger, I would appreciate any feedback :) https://github.com/ManuelHentschel/VSCode-R-Debugger |
|
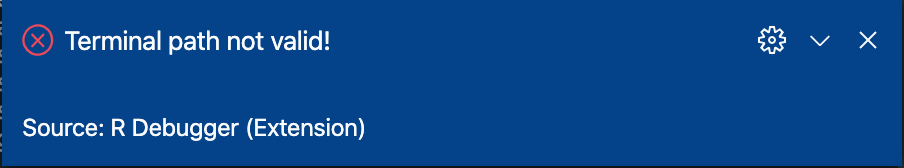
@ManuelHentschel Thanks for sharing your work on R debugger! I tried it but does not manage to make it work on macOS with the following error:
Am I missing something? |
|
In this step the extension tries to start a terminal/shell process in which to run the R session. I sometimes needed to restart vscode for changes to this setting to take effect. So far I have got this to work with bash on linux and cmd.exe on windows, but had no opportunity yet to test it on a mac. |
|
@ManuelHentschel Looks like the default setting "terminal.external.linuxExec": "x-terminal-emulator"is not a valid path for you to run. I change it to Great work! It's quite exciting to see what can be done to make both extensions work well with each other. |
|
Thanks a lot for figuring that out! |
|
@ManuelHentschel Thanks for your nice work in the R debugger for VSCode projects. It looks like the R code in vscDebugger could be largely improved. Would you mind if I participate in your debugger projects, give suggestions and contribute code? |
|
@renkun-ken Sure, I would gladly appreciate any help :) I just pushed some significant changes to the development branch of the R package, so be sure to pull those before you start coding yourself. |
|
Closing as there's VSCode-R-Debugger. |
Steps to Reproduce:
None
Do you want to fix by self? (I hope your help!)
No
(If yes,) what kind of help do you want? (e.g. Which file should I fix, Survey (related documents)
This is not bug report. I that possible to run R in debug mode with breakpoints?
If not could you be so kind to add this feature?
(If related)setting.json
Thanks for attention to my message and have a nice day.
The text was updated successfully, but these errors were encountered: