QGIS integration #5
Comments
|
Hi @Raruto
well, I am :) But I'm definitely not a js developer and luckily you are. What I have in mind is a very simple plugin where the user can choose:
Finally, one single html file is created with the link to the vector file (we can also choose to export a folder with the Writing a plugin in QGIS is pure python, so basically it is a kind of search & replace text into a template we can ship we the plugin that contains all the user customization. What do you think? |
|
if I understand correctly this is more or less what you need... <html>
<body>
<div id="map"></div>
<div id="elevation-div" class="leaflet-control elevation"></div>
<script>
var opts = {{ py_opts }}; // Your QGIS options here...
var map = new L.Map('map', opts.map);
var baseLayers = {{ py_layers }}; // Your QGIS layers here...
// Load all the user selected layers.
for (var layer in baseLayers) {
baseLayers[layer] = new L.TileLayer(opts[layer].url, opts[layer].options);
}
var controlZoom = new L.Control.Zoom(opts.zoomControl);
var controlElevation = L.control.elevation(opts.elevationControl.options);
var controlLayer = L.control.layers(baseLayers, null, opts.layersControl.options);
controlZoom.addTo(map);
controlLayer.addTo(map);
controlElevation.loadGPX(map, opts.elevationControl.url);
// Activate one of the user selected layer.
map.addLayer(baseLayers[opts.activeLayer]);
// Add the gpx layer as “toggable” layer
controlElevation.gpx.on('loaded', function(e) {
controlLayer.addOverlay(controlElevation.gpx, controlElevation.gpx.get_name());
});
// and so on...
</script>
</body>
</html>based on this example. |
|
Thanks @Raruto for the template. I'll try to work on the plugin ASAP.
well this could be the tricky part. QGIS read all the layers as Basically something like that:
|
|
from the C++ QGSI API reference (i think that the python API should be similar): QString QgsLineString::asJson( int precision ) const
{
QgsPointSequence pts;
points( pts );
return "{\"type\": \"LineString\", \"coordinates\": " + QgsGeometryUtils::pointsToJSON( pts, precision ) + '}';
} QString QgsGeometryUtils::pointsToJSON( const QgsPointSequence &points, int precision )
{
QString json = QStringLiteral( "[ " );
for ( const QgsPoint &p : points )
{
json += '[' + qgsDoubleToString( p.x(), precision ) + QLatin1String( ", " ) + qgsDoubleToString( p.y(), precision ) + QLatin1String( "], " );
}
if ( json.endsWith( QLatin1String( ", " ) ) )
{
json.chop( 2 ); // Remove last ", "
}
json += ']';
return json;
}The |
|
mmm nope, without the |
|
OK what we are looking for is the Now, before starting to work on the main framework. Most users load shapefiles in QGIS, is your library capable of taking a json string on the fly to render? In other words, in your examples (both gpx and geojson) you load directly a remote url: or a local file. Would it be possible to pass directly a json string in the url parameter like: ? We can then think to different options:
|
|
in version 0.2.1 I have slightly rewritten the library to be also able to handle the direct input of geojson/gpx data, so this is how your template should look like now: <html>
<body>
<div id="map"></div>
<div id="elevation-div" class="leaflet-control elevation"></div>
<div id="gpx-summary" class="gpx-summary"><span class="totlen"><span class="summarylabel">Total Length: </span><span class="summaryvalue">0</span></span> — <span class="maxele"><span class="summarylabel">Max Elevation: </span><span class="summaryvalue">0</span></span>
— <span class="minele"><span class="summarylabel">Min Elevation: </span><span class="summaryvalue">0</span></span></div>
<script>
var opts = {{ py_opts }}; // Your QGIS options here...
var map = new L.Map('map', opts.map);
var baseLayers = {{ py_layers }}; // Your QGIS layers here...
// Load all the user selected layers.
for (var layer in baseLayers) {
baseLayers[layer] = new L.TileLayer(opts[layer].url, opts[layer].options);
}
var controlZoom = new L.Control.Zoom(opts.zoomControl);
var controlElevation = L.control.elevation(opts.elevationControl.options);
var controlLayer = L.control.layers(baseLayers, null, opts.layersControl.options);
controlZoom.addTo(map);
controlLayer.addTo(map);
// Attach your elevation control to the map
controlElevation.loadChart(map);
// Fetch your gpx/geojson data as "url" or "object"
controlElevation.loadData(opts.elevationControl.data_url);
// Activate one of the user selected layer.
map.addLayer(baseLayers[opts.activeLayer]);
// Add the geojson/gpx layer as “toggable” layer and update track statistics
map.on('eledata_loaded', function(e) {
var q = document.querySelector.bind(document);
var track = e.track_info;
controlLayer.addOverlay(e.layer, e.name);
q('.totlen .summaryvalue').innerHTML = track.distance.toFixed(2) + " km";
q('.maxele .summaryvalue').innerHTML = track.elevation_max.toFixed(2) + " m";
q('.minele .summaryvalue').innerHTML = track.elevation_min.toFixed(2) + " m";
});
// and so on...
</script>
</body>
</html>
I haven't tested it, but I think that relative locations (eg "../data/demo.geojson") shouldn't cause problems...
if you intend "viewing multiple files at once" there is a basic example |
|
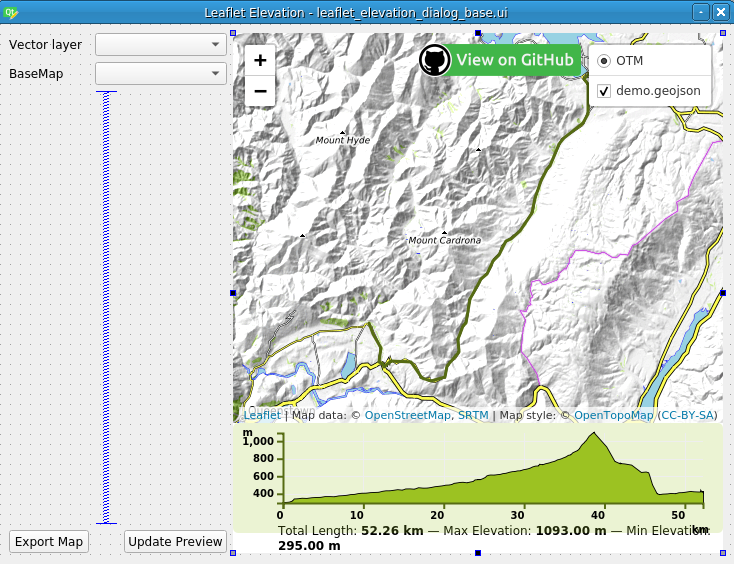
I've started the plugin framework here https://gitlab.com/faunalia/qgis-leaflet-elevation (sorry but we have almost all repo on gitlab, is it a problem for you?). The plugin works nice within QGIS (using your the geojson template https://raruto.github.io/leaflet-elevation/examples/leaflet-elevation_geojson-data.html) but only if the path is taken from a remote url, if the gejson (or gpx) is on the local disk, then the map appear but with an empty profile (this happens also directly in Qt Designer): Local file (html and geojson in the same dir of the ui file)
With your remote url
|

|
Just for testing, supposing to have a local |
|
I am the same Raruto also on gitlab. Modern browsers don't allow you to load local files unless you enable that with certain flags (eg. for chrome / chromium, but a better solution could perhaps be to use a localhost python web server...) From the official leaflet docs (#1, and #2), to be sure that the geojson file will be loaded at the same way both locally and from the remote server, they always use the alternative solution of an external .js file containing a global variable with all the necessary geojson data. geojson.js var geojsonFeature = {
"type": "Feature",
"properties": {
"name": "Coors Field",
"amenity": "Baseball Stadium",
"popupContent": "This is where the Rockies play!"
},
"geometry": {
"type": "Point",
"coordinates": [-104.99404, 39.75621]
}
};And here's how it should be used in version 0.2.2 controlElevation.loadData(JSON.stringify(geojsonFeature)); // in the near future I will remove the need of the "stringify" partPS are you sure to use here the latest version available? |
now yes ;) and it works nice with Do you have a working template of the last version with a Thanks! |
Have you also tried to load a local file with a chrome browser?
From version 0.2.x you can just use the Here is an example which shows how to load data directly from a javascript string (from 0.2.4 it should also work with xml/json objects too). And this should be the updated template: <html>
<body>
<div id="map"></div>
<div id="elevation-div" class="leaflet-control elevation"></div>
<div id="data-summary" class="data-summary"><span class="totlen"><span class="summarylabel">Total Length: </span><span class="summaryvalue">0</span></span> — <span class="maxele"><span class="summarylabel">Max Elevation: </span><span class="summaryvalue">0</span></span>
— <span class="minele"><span class="summarylabel">Min Elevation: </span><span class="summaryvalue">0</span></span></div>
<script>
var opts = {{ py_opts }}; // Your QGIS options here...
var map = new L.Map('map', opts.map);
var baseLayers = {{ py_layers }}; // Your QGIS layers here...
// Load all the user selected layers.
for (var layer in baseLayers) {
baseLayers[layer] = new L.TileLayer(opts[layer].url, opts[layer].options);
}
var controlZoom = new L.Control.Zoom(opts.zoomControl);
var controlElevation = L.control.elevation(opts.elevationControl.options);
var controlLayer = L.control.layers(baseLayers, null, opts.layersControl.options);
controlZoom.addTo(map);
controlLayer.addTo(map);
// Attach your elevation control to the map
controlElevation.loadChart(map);
// Activate one of the user selected layer.
map.addLayer(baseLayers[opts.activeLayer]);
// Add the geojson/gpx layer as “toggable” layer and update track statistics
// NB. it is always better to attach this event before the "loadData" function
map.on('eledata_loaded', function(e) {
var q = document.querySelector.bind(document);
var track = e.track_info;
controlLayer.addOverlay(e.layer, e.name);
q('.totlen .summaryvalue').innerHTML = track.distance.toFixed(2) + " km";
q('.maxele .summaryvalue').innerHTML = track.elevation_max.toFixed(2) + " m";
q('.minele .summaryvalue').innerHTML = track.elevation_min.toFixed(2) + " m";
});
// Fetch your gpx/geojson data as "url", "string" or "object"
controlElevation.loadData(opts.elevationControl.data);
</script>
</body>
</html> |
with you last addition that allows to load directly geojson strings no.. QGIS reads all the layers loaded as
that's really really awesome, thanks! The first skeleton of the plugin is ready. |
|
First prototype is working nice: https://gitlab.com/faunalia/qgis-leaflet-elevation/tree/master
|
Ok, however I think that in the future it might be useful to add an option / button that allows the user to decide how to export the geojson + html files (such as "complete web page" or "single html file").
Good to know. Perhaps, here it wouldn't be better to work directly with python obejcts and then inject them into the javascript as json variables (like that |
so as single html like now and html + geojson (so a folder with 2 files)?
mmm.. I know that the current function is a little bit tricky, but even if I inject the json dump of the returing Another current limitation if with multipart multilinestrings (working on that to find a way to manage also this geometries). |
Yes
This is more or less what I thought import json
# Your QGIS options:
opts = {
"map": {
"center": [41.4583, 12.7059],
"zoom": 5,
"markerZoomAnimation": false,
"zoomControl": false,
},
"zoomControl": {
"position": 'topleft',
},
"elevationControl": {
"data": 'https://raruto.github.io/leaflet-elevation/examples/via-emilia.gpx', # sample data placeholder
"options": {
"position": 'topleft',
"theme": 'lime-theme',
"useHeightIndicator": true,
"collapsed": false,
"detachedView": true,
"elevationDiv": '#elevation-div',
},
},
"layersControl": {
"options": {
"collapsed": false,
},
},
};
...
# Your QGIS geojson data function:
vlayer = self.layer_combo.currentLayer();
data = '''{{"name":"{layer}", "type":"FeatureCollection","features": ['''.format(layer=vlayer.name());
for i in vlayer.getFeatures():
g = i.geometry().constParts();
data += '{ "type": "Feature", "properties": { }, "geometry": { "type": "MultiLineString", "coordinates": [ ['
for part in g:
for coord in part.vertices():
data += ' [ {}, {},{} ],'.format(coord.x(), coord.y(), coord.z());
data = data[:-1];
data += ']] } },';
data = data[:-1];
data += ''']}''';
...
# update geojson data to your QGIS options:
json_opts["elevationControl"]["data"] = data;
...
# read your html template file
self.fin = self.leaftemplate
self.fout = os.path.join(os.path.dirname(__file__), 'template.html')
with open(self.fin, 'r') as fi:
lines = fi.readlines()
for i, j in enumerate(lines):
if '{{ py_opts }}' in j: # search for '{{ py_opts }}' placeholder
dataidx = i+1
json_opts = json.dumps(opts); # convert into JSON String:
lines[dataidx] = 'var opts = ' + json_opts + ';';
...
If I am not mistaken the library doesn't manage too "multi-track" gpses |
|
I reworked the code as you suggested (definitely a better approach): https://gitlab.com/faunalia/qgis-leaflet-elevation/commits/master
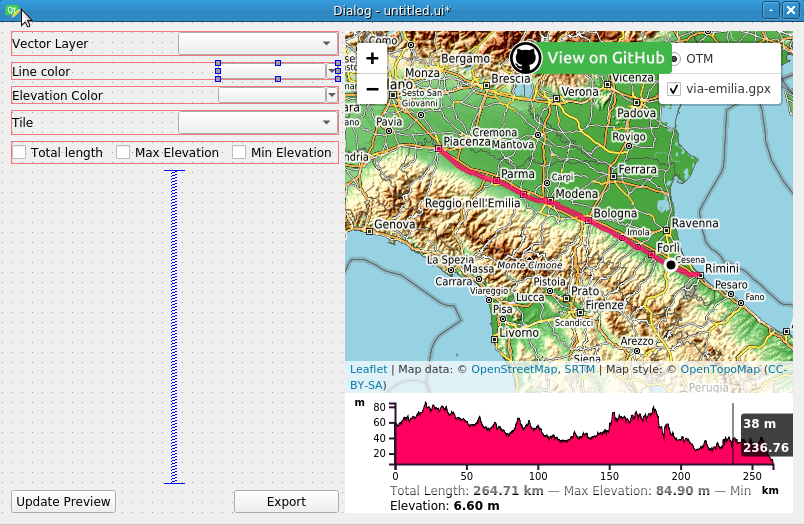
I managed a way directly in QGIS, tested with different gpx tracks (with multi linestrings) and it works nice What is still missing, as I pointed out in the issue on gitlab https://gitlab.com/faunalia/qgis-leaflet-elevation/issues/2 is what could be the best way to made (small) customization (basically line and profile color). |
Ok, good to know it. |
for more info: https://github.com/faunalia/trackprofile2web/issues |
I'm not a QGIS programming expert, but it seems feasible...
The text was updated successfully, but these errors were encountered: